
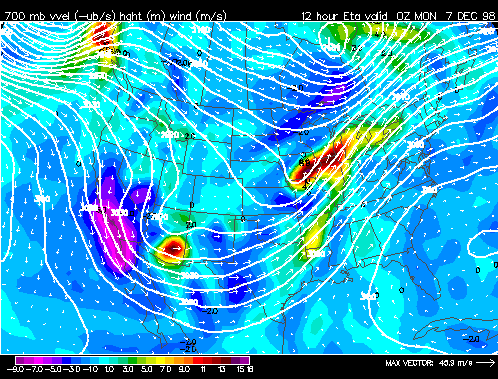
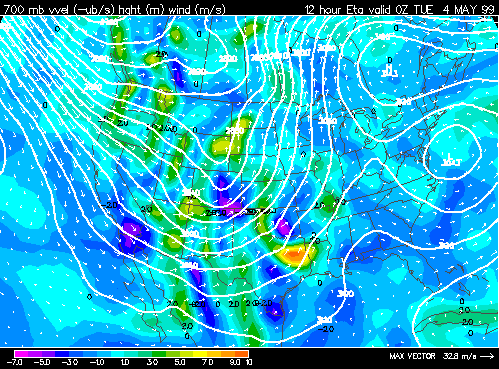
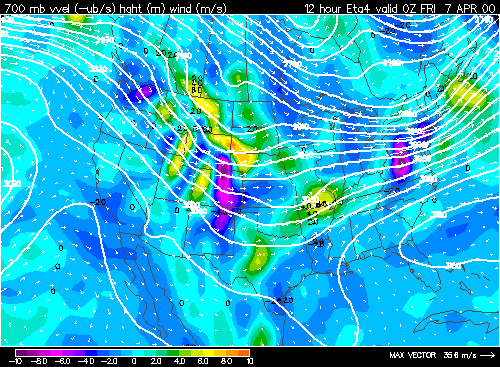
The 700 mb chart is the last of the low level charts. The 500 and 300 mb charts are considered the upper levels of the atmosphere. Many of the same processes analyzed on the 850 chart are also studied on the 700 mb chart. The trough/ridge pattern becomes more defined at the 700 mb levels as compared to lower levels. A trough is simply a southern "bulge" in height contours while a ridge is a northerly displaced "bulge". This "bulge" can be large (such as in association with a mid-latitude cyclone) or small (such as a shortwave). One of the most common questions from beginning analysts is "What is a shortwave?". First, the height contours "kink" within a shortwave. This kink can be seen as lower heights displaced downwards from the overall height contour pattern. Second, temperature advection often occurs within the short wave. Generally, cold air advection is found to the left of the short wave axis with warm air advection to the right of the trough axis. The trough axis is sometimes portrayed as a dashed line going through the middle of the shortwave. Third, the amplitude of a shortwave is small in comparison to a longwave trough. Below is a 700 mb weather chart showing examples of shortwaves. 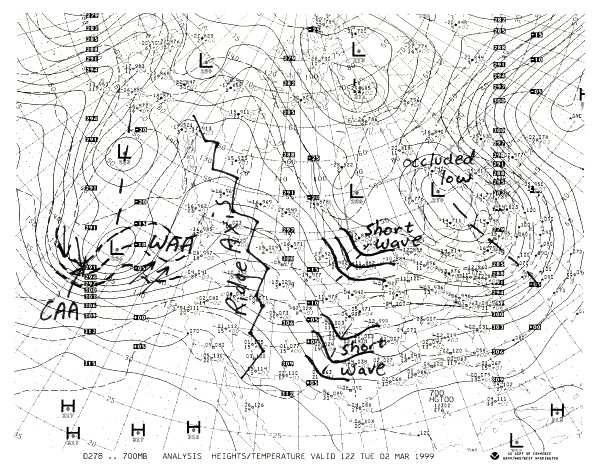 When examining model data at 700 millibars it is common for them to show upward vertical velocity. A good forecast strategy is to look at the 700 mb forecast panels for the upward vertical velocity distribution, then determine what forces in the atmosphere are causing the upward (or downward) vertical velocities. Below are three examples of shortwaves on a 700 mb UNISYS ETA model panel. PANEL 1: IOWA SHORTWAVE PANEL 2: EAST TEXAS SHORTWAVE PANEL 3: NORTHERN ARKANSAS SHORTWAVE WHAT TO LOOK FOR AT 700 MB: ONLINE location of 700 mb DIFAX: 700 MB ANALYSIS CHART ONLINE location of 700 mb Initialization: 700 MB INITIALIZATION (1) Find areas with low dewpoint depressions. Often this indicates a deep layer of moisture. Use 700 mb chart in combination with sfc and 850 charts to determine depth of moisture (2) Determine strength of warm air advection, cold air advection, and moisture advection. Thermal advection is a function of wind speed, wind direction, thermal gradient, and isotherm angle of intersection with height contours (3) Determine strength of high pressure/ low pressure. Strong organizing low pressures tilt toward the northwest with height. (4) Locate shortwaves. Determine if shortwave is barotropic or baroclinic. The baroclinic shortwave is more likely to produce precipitation. Rain and storms are generally on exit sector of shortwave. Compare shortwave with other levels in the atmosphere. Rain is likely to right of shortwave especially if dewpoint depressions are low. (5) Weather is warmer than normal under ridges and cooler than normal under troughs. (6) Look for the greatest height falls and height rises; these values give clues to how the trough/ridge pattern will change through time. (7) 700 mb front is found where height contours kink; kinking height contours may also be a shortwave (especially if thermal advection is present). A short wave can be an upper level front. |