
It is important to know (1) what thickness lines are, (2) the numerical value of each thickness line on the prog, and (3) applying the thickness lines to forecasting CAA and WAA. A thickness line is the vertical distance in meters between two pressure levels. The models commonly use the 1000 to 500 millibar thickness. The thickness is the vertical distance in meters from the 1000 to the 500 millibar level. The 1000 to 500 mb thickness is a function of two properties, (1) the average temperature of the air between 1000 and 500 millibars and (2) the average moisture content of the air between 1000 and 500 millibars. These two properties are combined together to produce the virtual temperature. Therefore, thickness is a function of the average virtual temperature between 1000 and 500 millibars. Thickness will INCREASE if the average virtual temperature increases (either temperature increasing or moisture content increasing or both). Thickness will DECREASE if the average virtual temperature decreases (either temperature decreasing or moisture content decreasing or both). Thickness will increase due to WAA or diabatic warming (solar heating). Thickness will decrease due to CAA or diabatic cooling (longwave cooling, evaporational cooling, etc.). The thickness values will be higher in the lower latitudes and the thickness values will be lower in the high latitudes. The thickness lines will be packed close together where there is a large temperature gradient in the atmosphere. Below this essay is an embedded image of the press/prec/thickness chart. Thickness is shown by the dashed and solid YELLOW ISOPLETHS. The thickness lines are displayed in increments of 60 geopotential meters. The solid yellow lines guide you to interpreting the value of each thickness line. The 5,700, 5,400 and 5,100 thickness lines will be shown in solid yellow. A thickness of less than 5,100 is associated with arctic air while a thickness of 5,700 or greater is associated with tropical air. The 5,400 line generally divides polar air from mid-latitude air. The 5,400 line is also used as a guide to the rain/snow line. On this chart, the 540 (another way of expressing 5,400 gpm) runs through Mississippi (follow its path across the entire U.S.). Everywhere North of this solid line, the thickness is LESS than 5,400. The first dashed line north of the 540 line is the 534 line (remember the lines are in increments of 60 gpm). The line dashed to the south of the 540 line is the 546 line. It makes sense that the thicknesses tend to decrease when moving north because the air tends to get colder as you go north. In this example below, the 570 line is in Mexico and the 510 line is between the Great Lakes and New England. Thickness near 510 will be associated with very cold air. The next stage is to apply your knowledge of the thickness lines. When cold air moves south, lower thickness lines will be associated with this cold air. In the example, cold air is filtering toward the south (wind speed and direction can be inferred using the blue isobars) in the eastern U.S. and this region has lower heights associated with it. CAA is associated with decreasing heights and WAA with increasing heights. 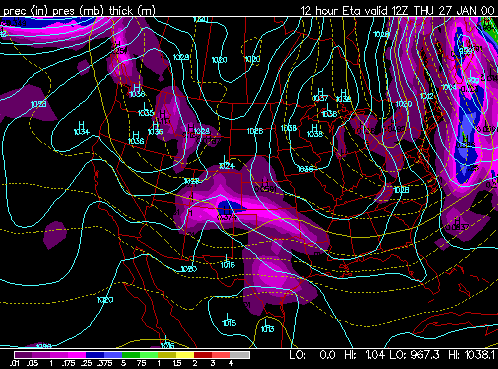
|