
Interpolation involves estimating a value based on the known values. This is done on meteorological charts that show contour lines such as isotherms, height contours, isobars and dewpoint contours. Basically all analysis, thermodynamic and forecast model charts have to use interpolation in some way in order to draw the contours or to find a point specific value based on the contours. Data for the analysis chart is available at specific locations while the chart is drawn to show the entire area. Interpolation has to also be done when reading thermodynamic values off of charts such as the Skew-T chart. Two examples of interpolation are given below. The example at the top shows a point T that is between two isotherms which are 20 C and 30 C. The question is, what should be value of T be? We know the value is between 20 C and 30 C. The next step is to note which temperature the point T is closest to. The point T is closer to 20 C. Thus, the temperature should be closer to 20 C than 30 C. Next, an estimation is done. T must be between 20 C and 25 C. An answer of 22 C or 23 C would be a reasonable answer based on the position of point T. This type of skill is routinely needed when reading data or plotting data on the Skew-T log-P diagram. In the second example, there are three x’s drawn on the diagram and each is labeled 1 through 3. All the x value are between 992 and 996 mb. There is a difference of 4 mb between these two values, thus in quarterly increments there is a 1 mb difference. For example, x1 is about exactly between 992 and 996, thus x1 is approximately 994 mb since it is half way between the two contours. X2 is much closer to 992 mb than it is to 996 mb, thus a reasonable value for x2 would be 993mb. X3 is much closer to 996 than it is to 992 mb, thus a reasonable value for x3 would be 995 mb. The skill of interpolation has to often be done when using analysis charts and trying to estimate what the specific value would be at a specific location when given the contour field. 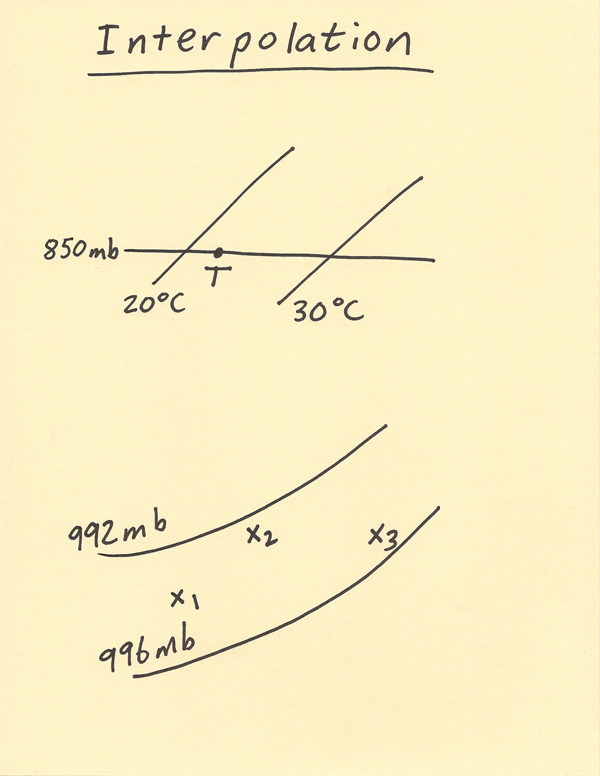 |