
The diagram below shows how the pressure changes with altitude. The vertical axis shows height in kilometers given in 6 km increments. The horizontal axis shows the pressure exerted by the air in millibars of pressure. Several pressure-height points are labeled on the diagram and then connected with a smooth curve. Note that the curve depicted is not a straight line but rather shows an exponential/logarithmic type relationship. The pressure decreases more rapidly with height in the lower troposphere (surface to 500 mb) and less rapidly with height in the upper troposphere (500 mb and upwards). In the lower 6 kilometers of the atmosphere the pressure reduces more than half. Why does this occur? There are a couple of reasons. Gravity pushes the air toward the surface. Gravity is a little higher closer to the surface than it is high aloft. Also, higher up in the atmosphere there is less air mass to compress the air below it. When approaching the Earth’s surface from above there is more and more mass aloft to compress the air. Thus the greatest amount of compaction occurs near the surface. The air density is highest near the surface and rapidly decreases with height above the surface. There is no real top to the atmosphere but rather it just gradually merges into outer space. Some of the consequences of pressure decreasing with height include: higher elevation regions having a much lower air density than sea level air, air expanding as it rises, the atmosphere overall being a relatively thin layer of gas surrounding the Earth, and air pressure changing rapidly with respect an aircraft taking off and landing. 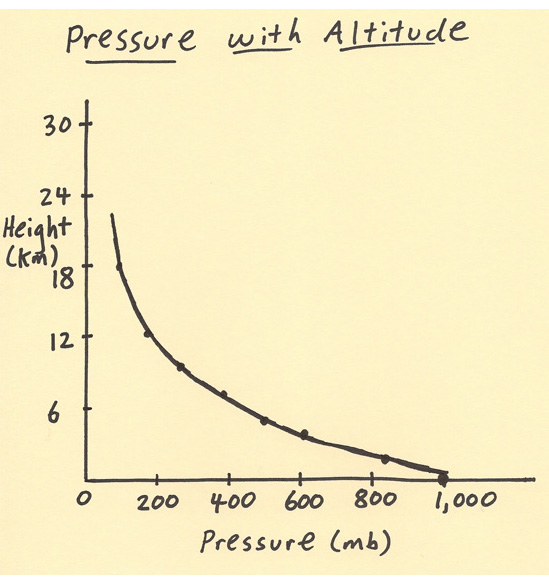 |