
| COLUMN AVERAGE RELATIVE HUMIDITY
| |||||||||||||||||||||||||||||||||||||||||||||||||||||||||||||||||||||||||||||||||||||||||||||||||||||||||||||||||||||||||||||||||||||||||||||||||||||||||||||||||||||||||||||||||||||||||||||||||||||||||||||||||||||||||||||||||||||||||||||||||||||||||||||||||||||||||||||||||||||||||||||||||||||||||||||||||||||||||||||||||||||||||||||||||||||||||||||||||||||||||||||||||||||||||||||||||||||||||||||||||||||||||||||||||||||||||||||||||||||||||||||||||||||||||||||||||||||||||||||||||||||||||||||||||||||||||||||||||||||||||||||||||||||||||||||||||||||||||||||||||||||||||||||||||||||||||||||||||||||||||||||||||||||||||||||||||||||||||||||||||||||||||
METEOROLOGIST JEFF HABY
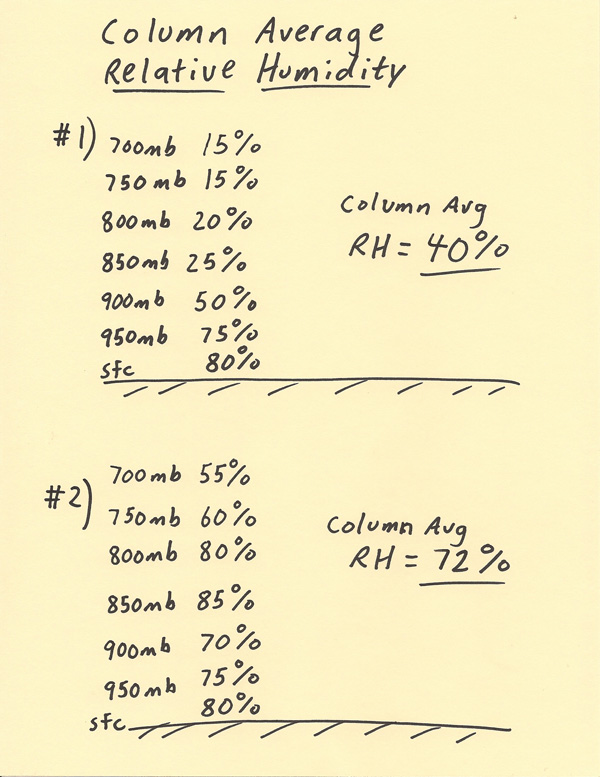
Column average relative humidity is the average relative humidity within a vertical column of air. To determine this, first the lower and upper
boundary of the layer needs to be indicated. Next, the relative humidity in stepped intervals is determining. Then the values are added up and
divided by the total number of values. In a Skew-T sounding there is a continuous motion of the instrument through the layer thus a large number
of relative humidities can be obtained. In the diagram below there is a simplified version of how column relative humidity is calculated. The
relative humidity value is taken in 50 mb intervals. In the first example, there are 7 relativity humidity measurements. Adding these up and
dividing by 7 yields a column average relative humidity of 40%. Even though the relative humidity is high at the surface, the very day air
aloft is lowering the average relative humidity of the layer. In the second example, the column average relative humidity is 72%. Even
though the surface relative humidity is the same in both samples, the column average relative humidity is higher in the second sample
since the air is not as dry aloft as compared to the first sample.
Column relative humidity is used to get a sense of how close a deep vertical extend of the troposphere is to saturation. If it is near
saturation, lifting will quickly be able to produce clouds and precipitation. If the air is fairly dry, precipitation is less likely in the near
term. The column relative humidity value given on a Skew-T chart is the surface to 500 mb column average relative humidity.
|
|
|