
1. What is the relationship between range folding and the Doppler dilemma? The PRF is the frequency of pulses that are emitted from a Doppler radar. A higher PRF means the radar is sending out more pulses per unit time. A lower PRF means the radar is sending out less pulses per unit time. When the PRF is high the radar has less time to sample the atmosphere between pulses. If the radar has less time to sense, it can not detect objects further away from the radar as compared to a low PRF. Thus, a high PRF has a smaller unambiguous range as compared to a low PRF. The Doppler dilemma states there is an inverse relationship between the unambiguous range and the unambiguous velocity. When PRF is low----unambiguous range is high---but that results in a low velocity range When PRF is high----unambiguous range is low---but that results in a high velocity range Example: Suppose a radar can sense up to 250 miles from the location of the radar (unambiguous range) and can detect velocities of up to 30 m/s before velocity folding occurs (aka velocity aliasing). If the PRF was increased, the unambiguous range will drop to say 200 miles but the unambiguous velocity will increase to say 35 m/s. 2. Which precipitation types are best detected by radar? In general, the larger the precipitation particle the better it will detected by radar. However, not all particles of the same size will have the same reflectivity. Ice is more efficient at absorbing the energy emitted from radar as compared to liquid water. Combining size and precipitation type, we get the following relationships. With each statement below assume the precipitation rate is equal: 1. Dry snow will have a lower VIP than wet snow 2. Wet snow will not only have a higher VIP than dry snow, it will also have a higher VIP than rain. Wet snow has a reflectivity similar to very large raindrops. A wet snow flake is larger in volume than a liquid rain drop even when they have the same mass. This high reflectivity of wet snow causes the "bright band" on radar. 3. Wet hail has a higher VIP than dry hail. Wet hail has the largest reflectivity of any precipitation particle. Radar sees wet hail as a gigantic raindrop. 3. What happens during velocity aliasing and range folding? Suppose the maximum unambiguous velocity is 30 m/s. If the wind is blowing at 35 m/s, the radar will show the 35 m/s wind as a 5 m/s wind instead. All wind speeds above 30 m/s will be aliased in this case. Computer algorithms can correct this aliasing or increasing the PRF can correct this aliasing. Suppose the maximum unambiguous range is 200 kilometers. If a storm is located at 225 kilometers from the radar, the radar will detect the storm as being 25 kilometers from the radar instead. Any energy returned to radar beyond 200 kilometers would be range folded. This occurs because the radar energy bounced off the distant storm is returning to the radar after the radar has already sent out another pulse and is "listening" for return echoes. Decreasing the PRF can correct this problem. 4. What happens during ducting? Ducting is exceptional super-refraction. Super-refraction occurs when the trajectory of a radar beam bends towards the earth's surface more than normal. In other words, the rate the elevation of the radar beam changes with distance away from the radar is less than normal. The radar beam will tend to increase in height above the earth's surface when moving away from the radar site because of the earth's curvature. In a super-refraction situation, the radar beam could be increasing at a lesser rate with height than normal as the beam moves away from the radar site or the beam could even be bending back down and getting closer to the earth's surface in spite of the earth's curvature. It is ducting when the radar beam actually bends closer the earth's surface with distance away from the radar. The bending could be strong enough for the radar beam to bounce off the earth's surface. Ducting is caused by strong low level inversions (temperature increases with height). Ducting can also occur when a strong cap (EML) of warm and dry air exists in the lower troposphere above very moist air. Ducting causes the radar to be able to sample much further distances than normal. Ducting increases ground clutter also since the radar beam remains closer to the earth's surface for a greater distance and can even bend into the earth's surface. Ducting is more common in the morning hours since this time of the day experiences the strongest low-level inversions (due to cooling of earth's surface through longwave radiation emission) but ducting can also occur anytime a strong cap exists in the lower troposphere. The advantages of ducting are increased radar range, being able to sample storms further from radar, and being able to sample lower elevations within storms further from radar. The disadvantages of ducting are increased ground clutter and increased anomalous propagation (due to radar beams bouncing energy back from hitting earth's surface or sampling storms beyond the radar's maximum unambiguous range). 5. How does radar detect precipitation particles? Radar sends out a certain wavelength of electromagnetic radiation. This electromagnetic radiation is of the longwave variety and therefore will not damage the environment. The energy emitted from the radar travels at about the speed of light as does all electromagnetic radiation. The speed of light is 299,800,000 m/s. With this speed, radar can sample hydrometeors during one pulse in a small fraction of a second. Radar can typically send and receive radiation between 200 and 3,000 times in one second. The number of pulses radar sends out is called the Pulse Repetition Frequency. Radar sends out electromagnetic radiation that strikes hydrometeors in the atmosphere. Some of this radiation reflects back directly toward the radar set. This energy that is reflected directly back is called backscattered radiation. The amount of energy the radar receives (compared to the amount it sends out) is very small. An example of this is to think about the amount of light reflected of Mars and seen on Earth compared to the total energy emitted from the Sun. The Earth only receives a very small amount of the total energy that the sun gives off that is reflected off Mars and toward the Earth. The amount of backscattered radiation the radar receives depends on the number of hydrometeors, the size of hydrometeors and absorption qualities of the hydrometeors such as density, shape and other unique properties. An object with a higher density, a larger surface area facing perpendicular to the radar's energy and composition of a more reflective material will send relatively more backscattered energy to the radar set. Radar is an active remote sensor. It sends out as well as receives electromagnetic radiation. The backscattered energy it receives is processed by the computer and put into a graphical form for the radar user. Higher amounts of backscattered energy correlate with higher VIP values on the graphical display. Because electromagnetic radiation travels at a known speed and the radar can process the time between radiation being emitted and received, a known distance to the hydrometeors can be calculated. Velocity (m/s) * Time (s) = Distance (meters). With the information of distance and amount of backscattered radiation, the data can be plotted on a graph showing intensity of precipitation and the direction / distance the precipitation is from the radar set. 6. Can RADAR detect a tornado? A tornado is a "violently rotating column of air in association with a cumulonimbus cloud that is in contact with the earth's surface". One limitation of RADAR is that it can not tell the RADAR operator if the mesocyclonic circulation is in contact with the ground. The RADAR operator can only go by probabilities from the magnitude of the gate to gate shear. The only method of determining if the tornadic circulation is on the ground is through the use of a trained storm spotter. Another limitation of RADAR detecting tornadoes is due the earth's curvature. As a storm locates further from the RADAR site, it becomes more likely the RADAR beam will overshoot the mesocyclonic circulation. It is best to use a low tilt angle because the higher tilt angles have a higher probability of overshooting the mesocyclonic circulation. Also, a tornadic / mesocyclonic circulation can not be detected if in moves into the RADAR's cone of silence (conal region immediately above RADAR set). Still another limitation is beam spreading. The pixel size increases when moving further from the RADAR set. This decreased resolution makes it more difficult to identify mesocyclonic circulations that are displaced far from the RADAR. The resolution of a tornadic circulation erodes rapidly beyond 100 kilometers from the RADAR set. Due to the shallow nature and brief life span of land spouts and gustinadoes, RADAR can usually not pick up the circulation associated with these types of tornadoes. RADAR is very successful at being able to detect a mesocyclonic circulation especially if it is located between about 50 to 100 kilometers from the RADAR set. Within this range, the RADAR has a more likely chance of detecting the core of the mesocyclonic circulation since it occurs in the mid-levels of a supercell. Strong outbound velocities of at least 45 knots next to strong inbound velocities of at least 45 knots are used to infer a mesocyclone. Even with this identification, less than 30% of mesocyclones that trigger the alert on the Doppler RADAR produce a tornado. 7. Supercell types, characteristic severe weather and the radar reflectivity signature with each There are three types of supercell thunderstorms: Classic supercells, HP (high precipitation) supercells, and LP (low precipitation supercells). Low level moisture and the value of precipitable water (PW) strongly determine which type of supercell a severe thunderstorm will be. LP supercells in the U.S. primarily occur in the Lee of the Rockies while HP supercells are common in the eastern Great Plains and eastward. Classic supercells are common in the Great Plains but can occur in regions where LP and HP supercells are common. The type of severe weather to expect from each of these supercell types and the radar reflectivity signature is given below: LP SUPERCELLS: STRONG STRAIGHT-LINE WINDS (due to a high amount of evaporative cooling as precipitation evaporates into surrounding low and mid-level dry air). LARGE HAIL (low amount of moisture results in a small water loading of the updraft, low PW values (less than 1.00 inch) allows the updraft to be stronger than it otherwise would have been if PW values were high). I have seen cases were an LP supercell produced baseball size hail and no other precipitation. TORNADOES (tornadoes tend to be weaker in association with LP supercells as compared to other supercell types because the forward flank downdraft and rear flank downdrafts are not as well defined and the storm is higher based). Tornadoes, if they do occur, are very visible in person due to the light amount of precipitation and a higher based wall cloud. LP supercells tend to be higher based than the other supercell types because air must rise to a higher level in the troposphere in order for condensation to occur. LP supercells are extremely difficult to locate on radar reflectivity since there is a lack of precipitation wrapping around the wall cloud. CLASSIC SUPERCELLS: Classic supercells give the best indication of a hook echo on Doppler radar. Many classic supercells are isolated from other storms. Classic supercells have varying degrees of hail size, tornado strength, and strength of straight-line wind. CAPE (how unstable the troposphere is) along with PW, freezing level and elevation determines how large hail will grow. Dry air in the mid-levels (large dewpoint depression) along with moisture in the PBL (high dewpoints) result in strong straight-line wind and convective instability. Strong low level speed and directional shear along with high CAPE form a favorable environment for tornadoes. HP SUPERCELLS: HP supercells have a kidney bean shaped appearance on Doppler radar. Many HP supercells occur in multicell supercell clusters or when a classic supercell draws increasing amounts of moisture into the circulation. These are often termed rain-wrapped supercells. Tornadoes are generally more deadly when they are rain-wrapped since their approach is unknown until they are right on top of you. Hail tends to be smaller in association with HP supercells than in association with the other supercell types because: 1) CAPE is reduced due to intense water loading 2) Freezing levels tend to be higher and elevations lower in association with HP's (compare high plains to Southeast U.S.). Strong straight-line winds are not as common with HP's since moisture extends through a higher depth in the troposphere. Evaporative cooling and negative buoyancy are lower because the dewpoint depression in the lower and middle troposphere tend to be lower (dewpoints higher). 8. What is a "hook echo"? A hook echo is displayed on radar reflectivity. It is a signature produced by precipitation held aloft that wraps around the mid-level mesocyclone. Since the mesocyclone has counterclockwise winds, the reflectivity signature of a hook echo will have a cyclonically shaped hook. The area free from reflectivity inside the hook is the updraft and inflow notch region of the supercell. A hook echo is one clue to a radar operator that a supercell has a potential of producing a tornado. Many of the violent tornadoes associated with classic supercells will show a distinct hook echo. Below is an instructional webpage showing a hook echo and many other supercell related features. http://www.spc.noaa.gov/faq/tornado/radscel.htm 9. What is the relevance of "Clear Air Mode"? Clear air mode serves a few useful purposes. It is often used when no significant precipitation echoes are on radar, when light precipitation is on radar, or when the detection of subtle boundaries in the troposphere is desired. During clear air mode, the radar antenna ROTATES MORE SLOWLY. This allows for a finer resolution and heightened sensitivity of the radar. The goal of clear air mode is to detect "clear air echoes". Clear air echoes include dust, insects, birds, and even subtle reflection differences produced along boundaries in the troposphere due to temperature and moisture gradients. Clear air returns (returns that would not show on precipitation mode) are typically 5 dBZ or less. Only the lowest tilt angles are used in clear air mode. This is because most clear air returns are in the lower troposphere. Less actual tilt scans compensates for the fact that each tilt scan takes much longer in clear air mode (remember the antenna is rotating more slowly). Even though there are less tilt scans to make up a volume scan, a clear air volume scan still takes twice as long as a precipitation mode volume scan since the antenna rotates much more slowly to catch the fine details in the troposphere. Also in clear air mode the PRF is decreased. This allows the radar to detect echoes further from the radar site but also contributes to tilt scans taking longer and an increase of velocity aliasing. The precipitation particles clear air mode is used to detect are primarily drizzle and light snow. Since the antenna rotates much faster in precipitation mode, the reduced sensitivity does not allow the radar to detect fine particles of precipitation or particles of precipitation that have minimal reflections. Ice is less reflective than water with respect to radar energy, thus a finer resolution of the radar beam is needed in order to detect small snow crystals. Clear air mode can also be used to locate frontal boundaries and mesoscale frontal boundaries such as outflow boundaries, sea breeze fronts and drylines. A sharp moisture and/or temperature gradient in the troposphere sets up an interface of higher reflectivity (an example is to think of skipping rocks on water, the rock is reflective as it hits the boundary between the air and water). In a case where rapid refraction occurs, some of the energy will backscatter. Also, convergence occurs along frontal boundaries. Dust and insects tend to convergence along synoptic and mesoscale frontal boundaries. These increased regions of bugs and dust allow for a higher return on clear air mode thus allowing for the detection of these boundaries. Bird migrations can also be detected in clear air mode. The instructional image below shows lake effect snow using clear air mode. Notice how much of the returns are 5 dBZ or less. 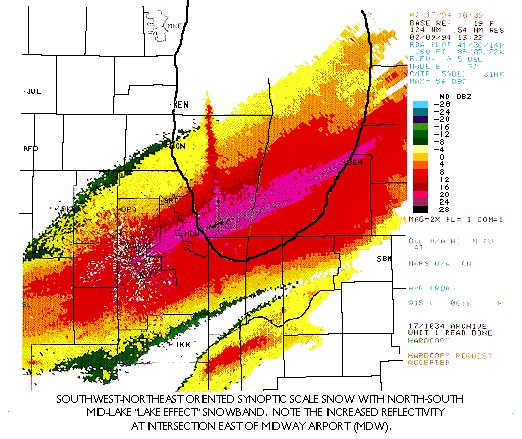
10. What is radial velocity, base radial velocity and storm relative radial velocity? The succinct definition of radial velocity is "motion toward or away from Doppler RADAR". This radial component only considers the wind speed along the horizontal plane the RADAR is sampling and only the wind component relative to the radar. The radial velocity relative to the RADAR site is also called "base radial velocity". Use base radial velocity in a situation where the winds from a storm are moving in a straight line of action such as winds associated with a squall line or gust front. Computer algorithms can produce a storm relative radial velocity when the storm movement is combined with the base radial velocity. Storm relative radial velocity is the radial wind component relative to the storm. The magnitude of base radial velocity will depend on the speed a storm is moving toward or away from the RADAR and the wind motions within the storm moving toward or away from the RADAR. The storm relative radial velocity will subtract out storm movement and will thus give radial wind information that is completely related to wind motions within a storm and relative to a storm. Use storm relative radial velocity when assessing rotation in a storm. The faster a storm moves the greater the difference will be between the base and storm relative radial velocity. 11. What is the Doppler shift? When an object emits light or sound, that light or sound will have a particular wavelength. If an object is moving, the object's motion will cause a distortion in the wavelength pattern relative to a "stationary" sensor. Keep in mind that this is an exercise in relativity. From the moving object's perspective, there is no distortion of the wavelength of light. It is sensors that are not moving at the same velocity as the object that will detect the shift in wavelength. Here is an analogy to clarify: Suppose a baseball player who is running at 10 mph throws a baseball at 50 mph in the same direction he is running. Relative to the running baseball player the ball is moving away at 50 mph. However, a stationary baseball player that catches the throw detects the ball approaching at 60 mph. This is because the motion of the running baseball player and the motion of the thrown ball are added together. An object moving toward a sensor will have a more rapid forward displacement of wave energy relative to the sensor. The sensor will detect a higher pitch or relatively shorter wavelength light. An object moving away from a sensor will have a less rapid forward displacement of wave energy relative to the sensor. The sensor will detect a lower pitch or relatively longer wavelength light. 12. What is the meaning of a TVS icon? A TVS (Tornado Vortex Signature) is a Doppler RADAR alarm resulting from at least 45-knot outbound adjacent to at least 45-knot inbound radial velocity. The supercell must be reasonably close to the RADAR in order for the RADAR to trigger the TVS. If it is above the RADAR, the tornadic circulation is in the RADAR's cone of silence. If it is too far from the RADAR, the beam will overshoot the circulation. The optimum distance occurs where the beam can sample the mesocyclone (and possibly the actual tornadic circulation) with several tilt angles. The NWS will often issue a tornado warning from RADAR evidence alone if the mesocyclone associated with the TVS is deep and persistent. Most of the strong and violent tornadoes have deep and persistent mesocyclones. If the tornadic circulation is in a favorable location to the RADAR (not too close or too far away), volume scans (through using various tilt angles) along with examining the output every 6 minutes can be used to assess the depth and persistence of the mesocyclone. A TVS on RADAR does not necessarily mean a tornado is occurring. To be a tornado the circulation must be on the ground. The RADAR is not able to tell if the "tornado signature" is on the ground. Less than 30% of even strong mesocyclones produce a tornado. There is another "volume of silence" the RADAR has and that is the volume underneath the lowest tilt angle. If the lowest tilt angle is 0.5 degrees, the RADAR will be unable to detect anything that could be detected under 0.5 degrees (a RADAR is only able to sample a planar area with each tilt angle). RADAR is sometimes taken out into the field during storm chases to collect data on the circulation that is near the ground for research purposes. 13. What is "beam spreading" and the consequences? In a 3-D sense, a beam of radar emission has a cone shape. The tip of the cone is at the radar site and the diameter of the cone gradually increases away from the radar site. As a radar beam moves further from the radar, it expands to take up a larger volume. An example of this process is to turn out the lights and shine a flashlight on the wall. First stand 2 feet from the wall and then gradually stand back further from the wall. You will notice as you keep standing further from the wall that the diameter of the brightest light striking the wall becoming larger and larger. You will also notice some light from the flashlight does not stay in the main flashlight beam. A small portion of the light fills the room (you will notice that when you shine a flashlight on the wall that the light becomes dimmer the further away it is from the bright spot on the wall). The light that is not in the main beam is similar to "side-lobes" that are produced by radar. A process called attenuation occurs as a radar beam of radiation leaves the radar site. Substances in the air absorb some radar radiation including hydrometeors. The more space a beam travels through, the more absorption that will take place of that beam. Energy backscattered from a storm near the radar will be more powerful than the energy backscattered from a distant storm. Backscattered radiation close to the radar does not undergo much attenuation. This causes rainfall intensity to be measured higher for storms near the radar as compared to far from the radar, all else being equal. The resolution of radar data decreases with distance from the radar. A "range gate" is the area encompassed by one pixel of radar data. These range gates become larger with increasing distance from the radar site since the beam is expanding as it moves away from the radar site. Large range gates will result in less resolution. An analogy is to think of two computer images where one looks crisp and sharp while another looks grainy. The grainy image has larger pixels and thus has a poorer resolution. The consequence of having a larger range gate results in an overestimation of the areal extent of rainfall. The value of dBZ in a range gate represents the average dBZ within that range gate. Also, the entire range gate must be filled with a dBZ value. In actuality, precipitation and/or heavy precipitation may only be occurring in part of the range gate. Since every range gate must be filled that has reflectivity coming from it, this causes the area that precipitation covers to be larger on radar than in actuality. This error increases with distance from the radar. In situations where only part of the range gate is filled, the reflectivity will be lower in that range gate than is occurring in actuality with the precipitation that is occurring in part of the range gate. The reflectivity will be lower because the reflectivity must be averaged over the entire range gate. As range gate size increases, it becomes increasingly more likely that only part of the range gate is being filled with precipitation and/or heavy precipitation. To sum up, as beam spreading increases (diameter of cone increases), rainfall intensity is increasingly underestimated, rainfall areal coverage is increasingly overestimated and precipitation and/or heavy precipitation in only part of the range gate increasingly becomes averaged over a larger area. The image below shows the errors produced by beam spreading. The radar site is in Columbus. Notice as you go further south the range gates become larger. The storms at the edge of the radar look more grainy and larger than the storms close to the radar. The storms near the edge of the radar are in actuality smaller than shown by radar. The storms near the edge of the radar are also being sampled at a higher elevation than the storms close to radar. 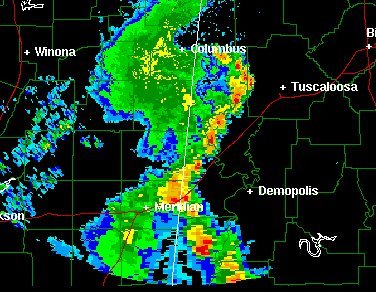 For current radar visit: NWS RADAR 14. Why do the middle levels of storms often have the highest reflectivity? In the warm season thunderstorm environment, the PBL (surface to ~5,000 ft) is warmer than the middle (5,000 ft. to 30,000 ft) and upper levels (above 30,000 ft) of a thunderstorm. Much of the precipitation that reaches the surface from thunderstorms is in the form of rain. In the middle and upper levels of the storm, ice is much more common than in the low levels of the storm. Hail is at its greatest size in the middle and upper levels of a storm. Hailstones in the upper levels of storms will be frozen solid. As the hailstones fall into warmer above freezing air they will begin to melt. A melting hailstone has a reflectivity of a gigantic raindrop. Reflectivity from "wet" ice is much stronger than from "solid" ice. Many hailstones melt before reaching the surface. Thus, the region of the storm with the best combination of wet hailstones and large hailstones will have the highest reflectivity. This often occurs in the middle levels of a storm. 15. What is spectrum width and the importance it has? Spectrum width is the distribution of velocities within a single radar pixel. One pixel on radar represents a volume. Within this volume can be literally millions of individual hydrometeors. Each individual hydrometeor will have its own speed and direction of movement. When turbulence exists in the atmosphere, individual hydrometeors within the radar pixel volume have vastly different radial velocities. In order to produce a pixel of radar velocity, the radar averages the individual radial velocities with a volume sample to produce a single average radial velocity that is displayed for that pixel. In a situation where shear and turbulence is small within a pixel, the spectrum width will be small. In a situation where shear and radial velocity is large within a pixel, the spectrum width will be large. A technical way of defining spectrum width is that it is the standard deviation of the velocity distribution within a single pixel. Spectrum width can be used to locate the center pixel of a TVS. Within the center pixel of a TVS will be a large velocity distribution (near zero at one location within the pixel and strong inbound and/or strong outbound velocities within that same pixel). Variations in the velocity distribution within a pixel occur depending on if the center of circulation is in the exact center of a pixel or near the edge of a pixel. The large distribution of velocities lead to a large standard deviation of velocities and thus a large spectrum width. Besides in association with a mesocyclone, spectrum width will show a turbulent pattern near any shear axis (such as the change in wind speed and direction along a squall line). 16. What is the difference between Accuracy and Precision? Accuracy is defined as, "The ability of a measurement to match the actual value of the quantity being measured". If in reality it is 34.0 F outside and a temperature sensor reads 34.0 F, then than sensor is accurate. Precision is defined as, "(1) The ability of a measurement to be consistently reproduced" and "(2) The number of significant digits to which a value has been reliably measured". If on several tests the temperature sensor matches the actual temperature while the actual temperature is held constant, then the temperature sensor is precise. By the second definition, the number 3.1415 is more precise than the number 3.14 An example of a sensor with LOW accuracy and LOW precision: Suppose a lab refrigerator holds a constant temperature of 38.0 F. A temperature sensor is tested 10 times in the refrigerator. The temperatures from the test yield the temperatures of: 39.4, 38.1, 39.3, 37.5, 38.3, 39.1, 37.1, 37.8, 38.8, 39.0. This distribution shows no tendency toward a particular value (lack of precision) and does not acceptably match the actual temperature (lack of accuracy). An example of a sensor with HIGH accuracy and LOW precision: Suppose a lab refrigerator holds a constant temperature of 38.0 F. A temperature sensor is tested 10 times in the refrigerator. The temperatures from the test yield the temperatures of: 37.8, 38.3, 38.1, 38.0, 37.6, 38.2, 38.0, 38.0, 37.4, 38.3. This distribution shows no impressive tendency toward a particular value (lack of precision) but each value does come close to the actual temperature (high accuracy). An example of a sensor with LOW accuracy and HIGH precision: Suppose a lab refrigerator holds a constant temperature of 38.0 F. A temperature sensor is tested 10 times in the refrigerator. The temperatures from the test yield the temperatures of : 39.2, 39.3, 39.1, 39.0, 39.1, 39.3, 39.2, 39.1, 39.2, 39.2. This distribution does show a tendency toward a particular value (high precision) but every measurement is well off from the actual temperature (low accuracy). An example of a sensor with HIGH accuracy and HIGH precision: Suppose a lab refrigerator holds a constant temperature of 38.0 F. A temperature sensor is tested 10 times in the refrigerator. The temperatures from the test yield the temperatures of: 38.0, 38.0, 37.8, 38.1, 38.0, 37.9, 38.0, 38.2, 38.0, 37.9. This distribution does show a tendency toward a particular value (high precision) and is very near the actual temperature each time (high accuracy). The goal of any meteorological instrument is to have high accuracy (sensor matching reality as close as possible) and to also have a high precision (being able to consistently replicate results and to measure with as many significant digits as appropriately possible). Meteorological instruments, including radar, need to be calibrated in order that they sustain high accuracy and high precision. 17. What are "Anomalous Propagation" and "False Echoes"? Anomalous Propagation is abbreviated as AP. AP and false echoes are one of the biggest enemies of the radar meteorologist. Those without experience in radar meteorology are often "burned" by AP and false echoes. AP is a false reflectivity echo on radar (a reflectivity echo that is NOT precipitation, especially echoes produced by unusual rates of refraction in the atmosphere). With experience you will be able to recognize which echoes are AP / false echoes and which are precipitation. If the index of refraction is at a standard level, computer algorithms can remove some of the AP and false echoes. In cases where the index of refraction is unusual, AP is much more likely to show on radar. In extreme cases, the air near the ground may be so cold and dense that a radar beam that starts out moving upward is bent all the way down to the ground. This produces strong echoes at large distances from the radar. Generally, the Doppler velocity of AP echoes is zero, but the echoes themselves can move around because propagation characteristics of the atmosphere keep changing. There are 4 common AP and false echo signatures. Each of these will be discussed below: a. GROUND CLUTTER- This is the most common false echo. It results from backscattering from the radar beam sidelobes. Ground clutter is most common when low elevation beam angles are used and in cases where a low-level inversion is in place. Ground clutter is the easiest false echo for the radar operation to recognize. It is easy to recognize since ground clutter does not move in any organized fashion, it has no kind of structure to it that is similar to real precipitation, and it is usually close to the radar. b. HIGH SUPERREFRACTION- Superrefraction is also termed ducting if the radar beam bend down toward the earth's surface enough to actually intersect the earth's surface. When radar beams bounce off the earth's surface some of that energy will backscatter to the radar to show AP. Ducting is more likely when a strong lower tropospheric inversion is in place, especially when the low-level air is moist and the air above the inversion is very dry. Ducting is more likely in the morning since inversions tend to be stronger in the morning (colder air under warmer air). When ducting occurs, ground clutter echoes are also much larger in spatial coverage since side lobes are more easily bounced off the earth's surface. c. ECHOES BEYOND MAXIMUM UNAMBIGUOUS RANGE- Radars send pulses out at the rate a several hundred per second. This can be done since radar beams move at the speed of light. After radar sends a single beam out, it listening for returning energy. The time it listens for return echoes from that single pulse is limited by the Pulse Repetition Frequency that the radar is set to. If energy from a previous radar beam is returned after radar has already sent out another pulse, this tardy backscattered energy will show at an incorrect range from the radar. The radar thinks all returns are from the pulse it just sent out. These can be some of the most difficult false echoes to recognize since the returns have a precipitation structure to them but they can be easily recognized if multiple radars are used and higher tilt angles are used. Often these misplaced echoes can be recognized since they have a grainy structure to them since these were echoes detected at a long range from the radar set. d. BIOLIFE, MOUNTAINS, ETC.- Mountains are an AP problem in some locations. The amount of reflectivity from the mountains will depend on the elevation angle of the radar beam and the current index of refraction in the atmosphere. There are all kinds of other objects that can produce echoes that are not precipitation including aircraft, birds, dust, and strong density gradients. The last thing a weather person would want to do is track AP or false echoes on radar thinking it is real precipitation. It is important to acquaint yourself with the situations in which AP and false echoes are likely to show on the radar sites within your forecast region. If you have data from more than one radar, AP and false echoes are easy to identify because the neighboring radars generally won't see the same thing. If you have just one radar but can look at different angles, you will find that AP and false echoes tends to be confined to the lowest elevation angles. When the radar is pointed higher in the sky, it's unlikely that the beam can be bent backward all the way to the ground. If you're stuck with just one radar and one elevation angle, you have to get more imaginative. The structure of AP echo tends to be "unusual", with sudden, sharp changes in intensity. Also, its motion tends to be erratic, although this can also be misleading. The best points of comparison are surface observations and satellite data. 18. What is Attenuation? Attenuation is the weakening of a radar beam as it moves downstream due to some of the energy being lost to scattering and absorption. The further a radar beam moves downstream the more dust, hydrometeors, etc. the radar beam will have to pass through. Because of attenuation, storms close to the radar are better sampled than storms far from the radar site. Beam spreading and attenuation both combine to produce a much poorer sampling of storms far from the radar. Attenuation is higher when the radar beam has the flow through a large number of hydrometeors. Storms and precipitation close to the radar degrade the radar energy before it reaches storms further from the radar. Smaller wavelength radar beams attenuate more rapidly than long wavelength radar. Because of this, most television station radars (C-band) have a shorter range of high clarity compared to the WSR-88D radar (S-band). 19. What is VIL (Vertically Integrated Liquid)? VIL was a "fad" and was most popular when the WSR-88D radar was first installed. VIL is the integration of reflectivity within a column of air. A higher VIL means there is more precipitation in a column of air. At one time it was thought a VIL value is associated with a certain hail size. The term "VIL of the day" was a term used by the NWS to describe the VIL value that associates with severe hail (3/4" of an inch in diameter or greater). If was found that the relationship between the VIL value and hail size is much more complex than previously thought. The VIL values correlation to hail size depends on season, synoptic environment, elevation, storm speed, storm structure, hail reflectivity characteristics etc. The relationship is too complex to issue a severe thunderstorm warning with respect to hail size from the VIL value alone, although the VIL value can be used as a guide and is especially useful if the VIL is very high. The VIL value has the following limitations: 1. The values are seasonally and regionally dependent. The value is also dependent upon the cloud physics and synoptic considerations for that particular day. 2. Values within 20 miles of radar will be underestimated since part of the storm will be in the radar's cone of silence. Values at the edge of the radar display are also underestimated since the higher elevation angles are overshooting the storms (lower half of storm is not being sampled). VIL values will be higher where all tilt angles are able to sample the entire precipitation / hail core of the storm. 3. VILs are less accurate for highly tilted storms. VIL is underestimated for tilted updrafts since the hail core tilts with respect to a vertical column of reflectivity. 4. VILs are higher for wet hail than dry hail 5. VIL value may be contaminated by non-precipitation echoes VIL can be used as a "guide" for assessing hail size and intensity of precipitation but as mentioned has many limitations. VIL has units of mass divided by area (kg/m^2). The mass is estimated by the radar reflectivity factor. VIL has a display similar to reflectivity products: heavier precipitation and hail will show a higher VIL (higher VIL value colors). 20. What are range, azimuth, elevation angle and echo height? Range = Distance from radar site to echo centroid Azimuth = Horizontal angular distance from true north measured clockwise from true north (east = 90 degrees, south = 180 degrees, west = 270 degrees, north = 0 degrees) Elevation angle = Number of degrees the beam is transmitted above the horizon. 0 degrees is parallel to horizon while 90 degrees is straight up Echo height = Vertical height above the surface to the target at which the radar beam intersects the target For more FAQ's click here: http://www.theweatherprediction.com/radared/radarfaq2/ |