
The Shenandoah Valley is a roughly 160 mile long stretch of land located in Western Virginia. It lies between two major east coast mountain ranges. On the eastern side are the Blue Ridge Mountains marking the western extent of the Coastal Plain. To the west is a much more significant area of mountains consisting of two ranges, the Appalachian and Allegheny ranges. The distance between these features and the entire width of the valley is only about thirty miles. The result is a multitude of orographic effects that can affect every aspect of a forecast. From cloud cover and temperatures, to precipitation amounts and fog, a forecaster must always consider how the mountains will play a part in the weather. This paper will highlight a few of the major difficulties forecasting in the Shenandoah Valley as well as identifying commonalities of specific weather events. 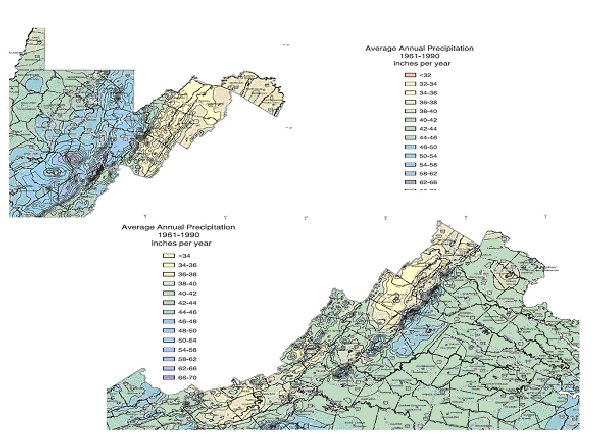 Fig. 1 A USDA schematic of annual average precipitation in Virginia and West Virginia from 1961-1990 shows in great detail the orographic affects of the mountain ranges on the Valley. (See figure 1.) The majority of Virginia averaged more than 40 inches of precipitation. In stark contrast, the small area on the western side of the state, the Shenandoah Valley, averaged less than 36 inches. The amount of average precipitation increases drastically on the mountains bordering the Valley. The Blue Ridge Mountains on the eastern side of the Valley averaged 46-58 inches (Climatesource.com). Precipitation averaged more than 52 inches with a maximum area above 64 inches on the western sides and toward the crests of the Appalachian and Allegheny Mountains in West Virginia. This varied precipitation patterns are caused by orographic lift. When air hits these mountain features it is forced to rise. The air then cools adiabatically and clouds and precipitation can result (Lutgens, Tarbuck, pg. 497). As noted by observation, winter time provides frequent examples of this orographic effect on the weather in the Valley. Various disturbances such as cold-fronts and Alberta Clippers can dump heavy amounts of snow on the western slope of the Appalachian and Allegheny ranges in West Virginia while leaving nothing but patchy clouds in the Valley. Deep upper-level troughs will often set off lake effect snow squalls. A strong northwest flow off the Great Lakes can send heavy snow squalls deep into the West Virginia mountains. This same air rises, condenses, and then downslopes over the many ridges in West Virginia. It dries so much there is nothing but patchy clouds left by the time the squalls enter the Valley. If there are any embedded disturbances in the upper flow such as an Alberta Clipper, similar precipitation coverage can be expected but there are some differences. The Blue Ridge Mountains to the east of the Valley often start yet another round of orographically induced precipitation. If LOW pressure intensifies over the Virginia Capes, the precipitation usually doesn't spread west of the Blue Ridge. Atlantic moisture often doesn't have a chance to get involved in the weather over the Valley. The effect of the Blue Ridge is much more pronounced during the warm season because of the influence of moisture from the Atlantic Ocean. During the passage of cold-fronts, the heaviest thunderstorms often develop just to the east of the Blue Ridge. The Ridge acts as a focal point for convection when the coastal plain is more unstable than the Valley. Thunderstorms can be extremely difficult to predict for the Valley even when the most pronounced line of storms approaches. There are many times, probably more often than not, that storms will weaken dramatically before entering the Valley. From both the average precipitation coverage mentioned above and personal observation, one can conclude the mountains of West Virginia are more likely to pick up the most rainfall during a frontal passage moving west to east. A secondary area of heavy rain can be expected somewhere along or just west of the Blue Ridge in this situation. This radar image serves as an example to illustrate the common precipitation coverage seen during winter precipitation. (See figure 2.) This image was taken April 6, 2007. Even though this particular system is anomalous for early April, it brought accumulating snow to much of Central Virginia and resembled a late winter snow event. A strong short-wave buckled southward and LOW pressure developed rapidly over North Carolina. Unusually cold air was already in place and the thermal profile was right for snow. Notice the break in the precipitation coverage over the western flank of Virginia over the highlighted area. 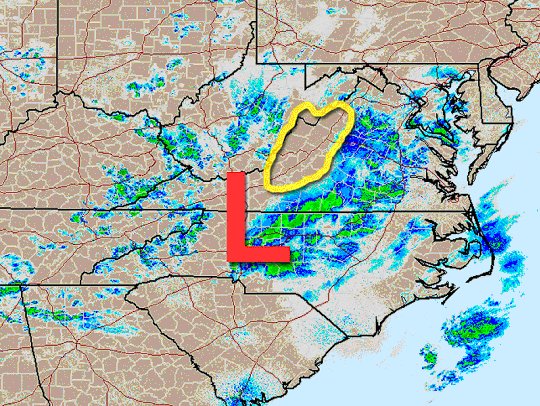 Fig. 2 There are some situations where the mountains have little or no effect on precipitation amounts. This often is noticeable during major storms that develop in the Gulf of Mexico or off the Eastern Seaboard, many of which become Nor'easters. This was evident during the January 6-8th Blizzard of 1996. An area extending from southern Virginia all the way up to coastal New England received more than 20 inches of snow (Kocin, Ucinelli pg. 600). Similarly, the March 1993 “Storm of The Century” brought a large swath of uniform snowfall to the area. These are obviously rare events. By studying the averages, one can conclude it takes a large and powerful cyclone to offset the orographic effects of the mountains. The mountains still have a dramatic effect on the weather in the Valley even when there is no precipitation or storms in the region. The development of cumulus over the mountains is almost a daily occurrence in fair weather. Orographic lift and daytime heating provide just enough upward vertical velocity to produce the updrafts needed for small cumulus. Walls of cumulus will often line the mountains while the Valley remains cloud free. Figure 3 is a visible satellite image taken in the late afternoon on April 3, 2007. (See Figure 3.) The background is colored and the image has been cropped. It was a warm day with highs near 80. Notice the large area of patchy clouds over West Virginia. One can also notice an abrupt break in the clouds when just west of the Valley. Note the small line of clouds just east of the break within the yellow circle. These are cumulus over the Blue Ridge. One can see how they parallel the mountains and run in a southwest to northeast direction. During days with high dew points and warm temperatures, cumulus will sometimes build enough to generate isolated thunderstorms. This creates other issues not covered in the scope of this paper. 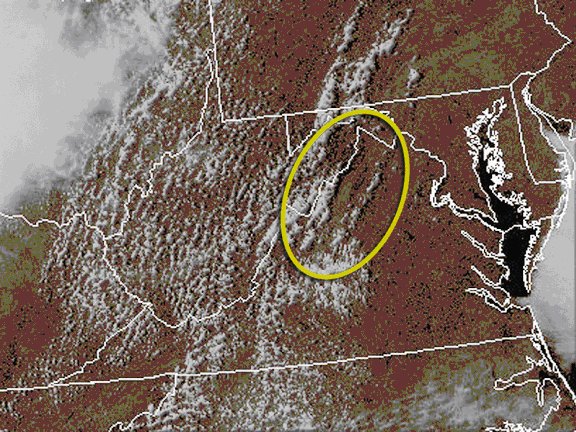 Fig. 3 The Shenandoah Valley is a region with variable and complex weather. With the use of precipitation records and careful observation, the orographic effects of the mountain ranges can be recognized. This enables the forecaster to anticipate the behavior of any system entering the Valley. WORKS CITED Lutgens, Fredrick K., and Edward J. Tarbuck. The Atmosphere, an Introduction to Meteorology. 9th ed. Upper Saddle River, NJ: Prentice Hall, 2004. 497. Kocin, Paul J., and Louis W. Uccellini. Northeast Snowstorms. Vol. 2. Boston, MA: The American Meteorological Society, 2004. 600. "Virginia Precipitation Data/Maps." United States Department of Agriculture. 1991. USDA. 3 Apr. 2007 |