
When most people think about the Pacific Northwest, they immediately think non-stop rain. While Seattle and the rest of the Puget Sound certainly live up to this expectation, life is much different on the other side of the Cascades. Living in the Yakima Valley or the Columbia Basin is just like living in any of the desert areas of California, Nevada, or Utah. We don't see much rain annually, and accurately predicting rainfall is notoriously difficult because of the Cascade rain shadow. This is one of the biggest challenges that forecasters face in the Interior Northwest. Before explaining the rain shadow effect and how it operates in the Pacific Northwest, it is helpful to understand the geography of the area. Below is a topographical map of Washington that shows the Cascade Mountains running from the state's southern border with Oregon to the northern border with British Columbia. Seattle is located just west of the Cascades in an area called the Puget Sound. My forecast area is the flatter, drier land east of the Cascades called the Columbia Basin. The Basin gets its name from the Columbia River. Figure 1 - Washington Topographical Map 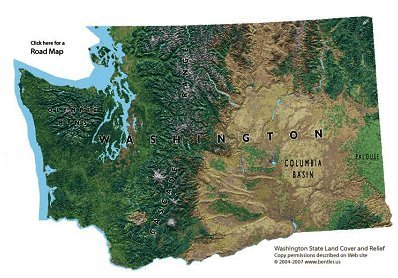 Figure 2 - Washington Roads & Cities Map The image below is a map showing the major cities in the state of Washington. I forecast for Central Washington (Ellensburg, Yakima) and for the Mid-Columbia region (Richland, Pasco, and Kennewick - collectively known as the Tri-Cities). On a clear day, you can see the Cascade Mountains rising in the distance from several locations, including downtown Yakima. 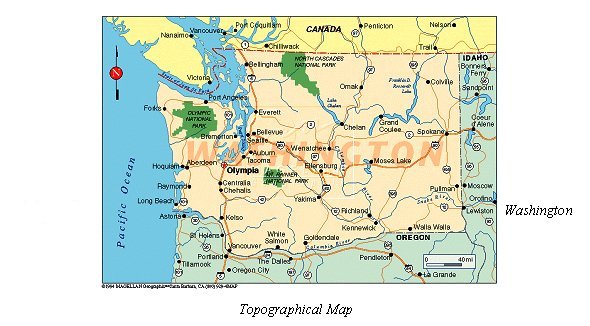 Figure 3 - Yakima & Mt. Adams Storms have a difficult time escaping the Cascades with their moisture intact because many of the mountain peaks reach more than 10,000 feet above sea level. Mt. Adams is 12, 307 feet above sea level and the highest point in Washington, Mt. Rainier, is 14, 410 feet above sea level. The valleys on the eastern side of the Cascades, however, are much lower. The average elevation for Yakima is 1,100 feet and the Tri-Cities is only at 400 feet above sea level. This sharp rise and steep decline in elevation is the setup for the process known as the Pacific Northwest rain shadow. 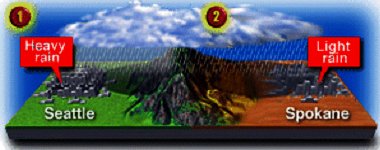 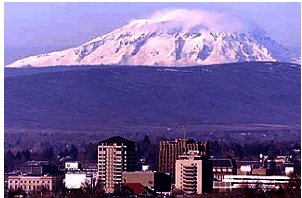 Figure 4 - Rain Shadow Effect The rain shadow effect is a phenomenon caused by the forced lifting of air over a topographic barrier, such as the Cascade Mountains. When this type of lifting occurs, it is called orographic lifting. In Washington, storms usually move in off the Pacific Ocean and travel over Seattle and the rest of the Puget Sound before slamming into the western slopes of the Cascades. This is called the windward side of the mountains. Since the moist air cannot move through or beneath the mountains, it is forced to rise over the mountain slopes. When this happens, adiabatic cooling often creates clouds and abundant precipitation. After the air moves over the Cascade Crest, it begins to descend on the leeward side of the mountains. By this time, the storm has lost most of its moisture in the form of rain or snow. As the air descends, it warms adiabatically. This warming process makes condensation and precipitation even less likely because warm air is able to hold more moisture than cool air. This process results in a rain shadow desert for the eastern half of Washington. The rain shadow doesn't prevent precipitation from ever occurring east of the Cascades, but it severely limits the amount of rain cities in my forecast area will see from most storms. Mike Vescio, the Meteorologist in Charge at the Pendleton, Oregon National Weather Service says, "The Columbia Basin actually is by definition a desert. They receive less than eight inches of precipitation a year. So it is a little tricky to figure out when they're going to get a good rainfall versus a few sprinkles or very light rainfall." You can see this on the following image: Figure 5 - Washington Annual Precipitation Vescio says the rain shadow effect is most prominent in the winter in the Pacific Northwest. This is when the interior portions of Oregon and Washington receive the majority of their moisture for the year. According to the National Weather Service, the annual rainfall for Yakima is 8.3 inches per year. The Tri-Cities receives less moisture with only 7.94 inches of precipitation per year. In contrast, Seattle averages 38.6 inches of rain per year. Precipitation in the mountains is even higher. Annual precipitation in the Cascades usually exceeds 100 inches or more. In fact, several of the world records for total annual snowfall have occurred in the Cascade Mountains. 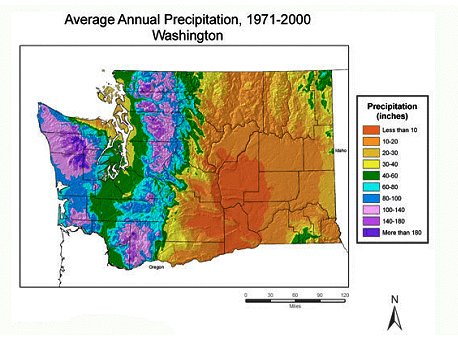 Figure 6 - Washington Monthly Precipitation 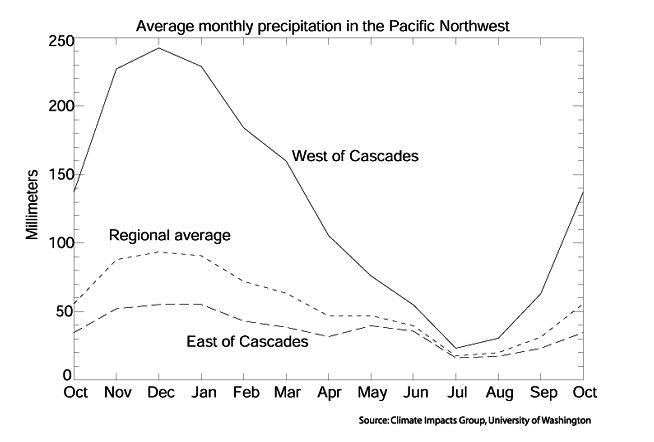 The rain shadow effect is very difficult to forecast for in the Northwest because of the variety of storm tracks and the variety of terrain the storms cross before they reach eastern Washington. Vescio says there are three primary indicators forecasters can look at though to help determine whether a storm will actually bring rain to the Interior Northwest. The first thing he says to look at is the direction of the wind flow aloft. He says, "The greater the westerly flow is aloft, the more likely that rain shadow effect is going to extend well east of the mountains. If the flow aloft is out of the west at several levels of the atmosphere, say from 5,000 to 10,000 feet, then that rain shadow effect is going to be pretty pronounced east of the Cascades. If the winds aloft are more out of the south or southwest, then that rain shadow effect from the Cascades is minimized and then we can get some good rains east of the Cascades." The second indicator forecasters should analyze is the strength of the storm. Vescio says low-amplitude, fast moving systems with westerly flow will usually bring good amounts of precipitation to Seattle, Portland, and the west slopes of the Cascades. However, these storms generally won't bring much, if any rain east of the Cascades. Vescio says, "The deeper the low pressure systems are as they approach the coast, generally that means the more meridional or southerly the flow aloft is ahead of those systems. So the stronger the system, generally speaking, the better the chance for precipitation east of the Cascades." The final element forecasters need to look at to produce an accurate rain shadow forecast is the storm track. Vescio says storms that move in from British Columbia or from the northern Pacific have a west or northwest flow and move southeast across Washington and Oregon. He says these storms generally don't have much moisture to begin with and are even further affected by the Cascade rain shadow. He says a better recipe for rain in Yakima and the Tri-Cities comes from storms that either move due east off the coast of Oregon or northeast off the coast of northern California. If a storm takes a track across Central Oregon toward the Mid-Columbia, Vescio says this brings our forecast area the best chance for precipitation. He says sometimes these storms have a tropical connection and they entrain moisture all the way from the Hawaiian Islands. When a tropical connection is in place, that's a good indicator that we'll have a better chance for rain in the Interior Northwest. Even with all of these tips though, forecasting for the rain shadow effect will always remain difficult. Vescio says a good rule of thumb is to stay conservative with rainfall estimates and to remember that Yakima and the Tri-Cities only receive eight inches of rainfall per year. He says it's tempting to forecast more rain when a large storm is moving into the area, but if you follow the rules and look at the indicators, your forecast will more likely be a success instead of a bust. Figures 1. Washington Topographic Map: http://images.google.com/imgres?imgurl=http://www.bentler.us/washington-state/maps/img/washington -state-map.jpg&imgrefurl=http://www.bentler.us/washington-state/maps/washington -landscape-map.aspx&h=470&w=709&sz=69&hl=en&start=1&um=1&tbnid=ACHxXk66LD6S-M:&tbnh=93&tbnw=140&prev= /images%3Fq%3Dwashington%2Bstate%2Bmap%26um%3D1%26hl%3Den 2. Washington Roads & Cities Map: http://www.forks-web.com/maps/washroad.gif 3. Yakima & Mt. Adams: http://www.djc.com/stories/images/20031211/Yakima_MtAdams.JPG 4. Rain Shadow Effect: http://www.usatoday.com/weather/tg/wrnshdw/wrnshdw.htm 5. Washington Annual Precipitation: http://www.learner.org/channel/courses/envsci/ visual/ visual.php?shortname=washington_precipitation 6. Washington Monthly Precipitation Graph: http://cses.washington.edu/cig/pnwc.shtml (Monthly mean precipitation for the PNW for 1900-1998: east and west of the Cascade crest, and the average monthly precipitation for the region as a whole. Data source: NOAA Climate Services Division. Figure source: Climate Impacts Group, University of Washington) References 1. Cascade Mountains Facts - http://www.netstate.com/states/geography/wa_geography.htm 2. Washington Climate Facts - http://cses.washington.edu/cig/pnwc/pnwc.shtml 3. Rain Shadow Definition - "The Atmosphere: An Introduction to Meteorology" by Frederick K. Lutgens and Edward J. Tarbuck, 2004 4. Annual Precipitation Totals - Pendleton, Oregon National Weather Service |