
Negative vorticity advection (NVA) is a process that contributes to a sinking of the air. This is important to a weather forecast since sinking air contributes to fewer clouds and less precipitation chances. This mini lecture will address the analysis of the negative vorticity advection process. Vorticity advection is analyzed at 500 mb since this pressure level is about half way through the vertical depth of the mass of the atmosphere. This pressure level gives a more pure analysis of the vorticity advection process as compared to using pressure levels that are above or below 500 mb (i.e. 700 mb and 300 mb). Negative vorticity advection occurs within troughs (both shortwave and long wave troughs). Negative vorticity advection is the replacement of higher values of vorticity by lower values of vorticity. Thus, the term “negative” is similar to “replacement by lower values”. The term advection means the wind flow is allowing a movement of vorticity isopleths into a fixed point. 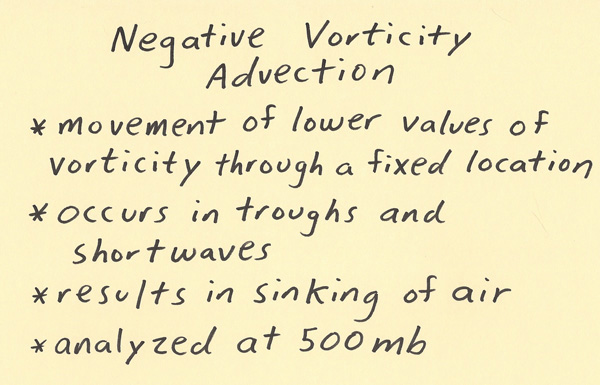 The location of a region of vorticity with the highest value is termed the “vort max”. Vorticity is increased by an increasing counterclockwise curvature of a wind flow (Northern Hemisphere). Thus, the location that has the greatest curvature though the combination of counterclockwise speed shear, counterclockwise curvature shear and Coriolis will be the location of the vort max. This will be further explained later in this writing. The left side of a trough is generally where the vorticity advection will be negative. This goes right in line with the left side of the trough being the region that generally has the decreasing amounts of lifting, clouds and precipitation. Note that PVA and NVA regions are adjacent to each other. Thus, where strong PVA is found there will also be NVA adjacent to it. Both PVA and NVA will occur near the vort max, with the occurrence of NVA or PVA depending on which side of the vort max a location is at relative to the wind flow. The diagram below shows a trough with the vorticity values (with vort max) within the trough. The wind is fairly parallel to the height contours. In the region to the left of the vort max, the wind flow is advecting in lower values of vorticity. This region (upstream region of vort max) has sinking air due to negative vorticity advection. 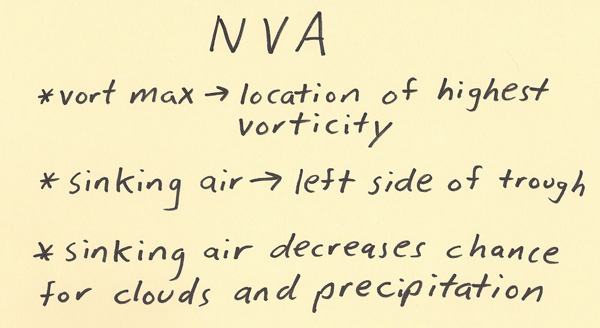 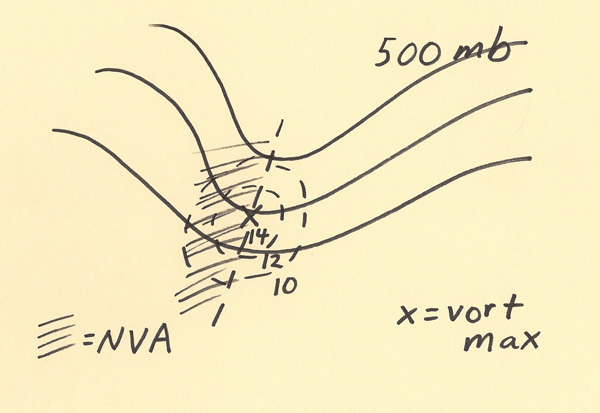 The vort max tends to be located within the center of the trough. In this region, the counterclockwise curvature tends to be greater and the wind flow tends to be greater (tighter height contours). The enhanced curvature leads to higher curvature vorticity while the closer height contours leads to higher shear vorticity. Shear vorticity is generated by a change in wind speed over distance. For example, when wind to the south of a location is strong while wind to the north of a location is weak, this will lead to a counterclockwise twisting over time. Vorticity will be weakened when the wind flow is undergoing clockwise curvature or when the wind shear produces a clockwise turning over time (anticyclonic shear). See diagram below. Note that NVA is not a process that is causing vorticity reduction. The best NVA will be found next to a high magnitude vort max and PVA. Vorticity reduction is mentioned here since a reduction in vorticity will cause a weakening in the magnitude of a vort max and thus the weakening of both PVA and NVA. 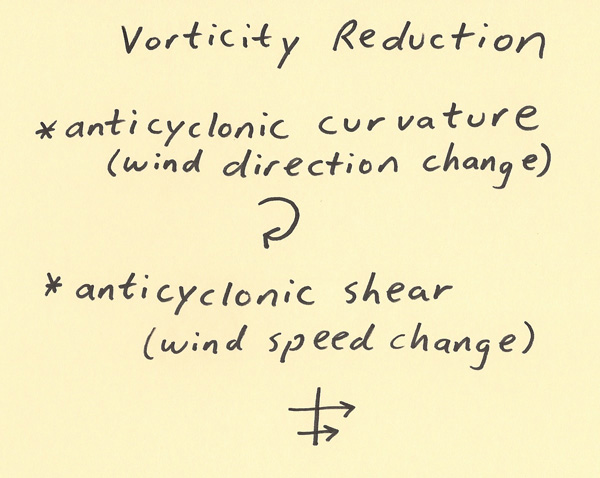 |