
The hypsometric equation (shown below) is one of the most important equations in meteorology. The hypsometric equation solves for thickness, which is the vertical distance between two pressure levels (for example the vertical distance in meters between the 850 mb and 700 mb level). The P1 and P2 terms on the right side of the equation are the two pressure levels. The Rd and g terms are constants which means they have a fixed numerical value. Thus, the equation is basically a relationship between thickness and the average virtual temperature of the layer. Virtual temperature is the temperature when considering the density input from moisture in the air, but the virtual temperature is close to the actual temperature since moisture has a minor influence on air density as compared to temperature. Average virtual temperature means taking a discrete sample of virtual temperatures between P1 and P2, adding them, and then dividing by the number of virtual temperature values. As the virtual temperature increases, the thickness increases since warming air is less dense and thus occupies a larger volume. The larger volume of air results in a greater vertical distance between two pressure levels. 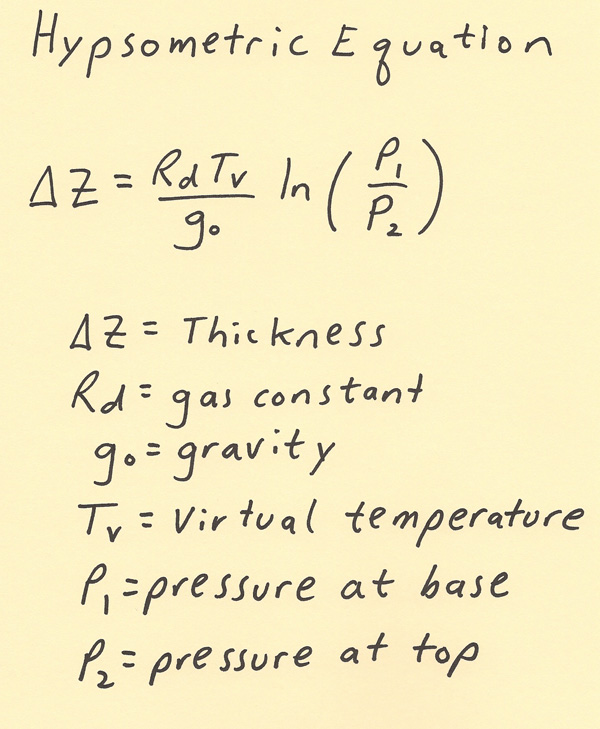 The diagram below shows visually the effect of increasing the temperature. The thickness (delta Z) after warming is a greater vertical distance than the delta Z before warming. Cooling of the air has the opposite impact. As air cools, the thickness (delta Z) becomes less. 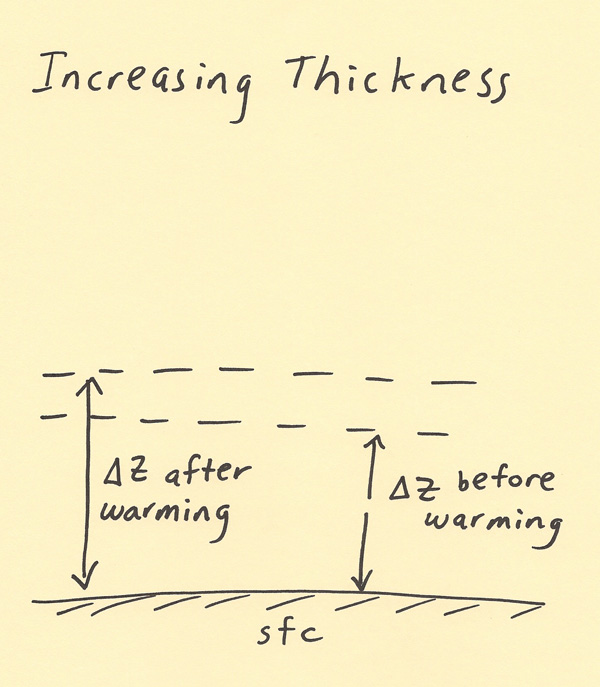 The two pressure levels can be chosen as needed for the particular analysis and forecast application. Below is an example of the 850 to 700 mb thickness. There are many additional thickness values used in forecasting such as the 1000 to 500 mb thickness, 1000 to 700 mb thickness, and the 1000 to 850 mb thickness. All these used in combination help predict the precipitation type that will occur and predict the vertical temperature structure of the troposphere. Thus, thickness values have strong applications in winter weather forecasting, developing height contour analysis/forecasting charts and temperature forecasting. 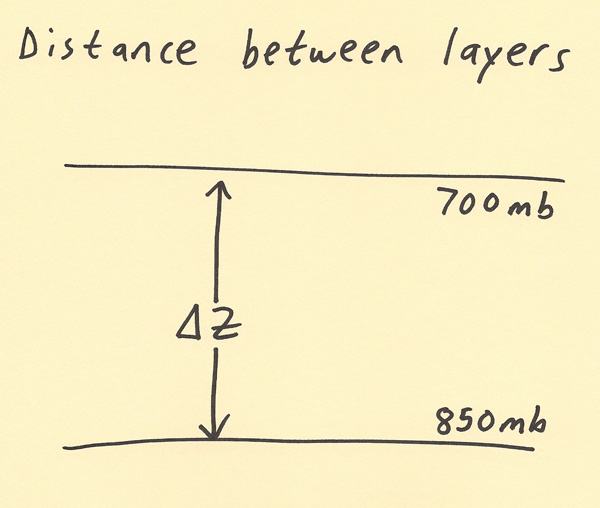 |