
A jet streak is a region of high speed wind within the jet stream (subtropical jet stream / polar jet stream). The best charts to analyze jet streaks within the jet stream are the 300-mb chart in the winter and the 200-mb chart in the summer. The jet core is the segment of the highest speed wind within a jet streak. This is typically toward the center of the jet streak. The jet streak is divided into 4 sections with the middle of the jet streak being where the strongest wind is located. The entire jet streak does not move as fast as the winds that are flowing through the jet streak. For example, the entire jet streak may be moving at 25 knots while the maximum jet streak winds are 140 knots. Thus, wind moves through the jet streak. The 4 sectors of a jet streak given below are the left rear quadrant, the right rear quadrant, the left front quadrant and the right front quadrant. A jet streak can also be divided into two regions called the entrance sector and the exit sector. Wind enters the jet streak within the entrance sector (which are the left and right rear quadrants) and exits within the exit sector (which are the left and right front quadrants). 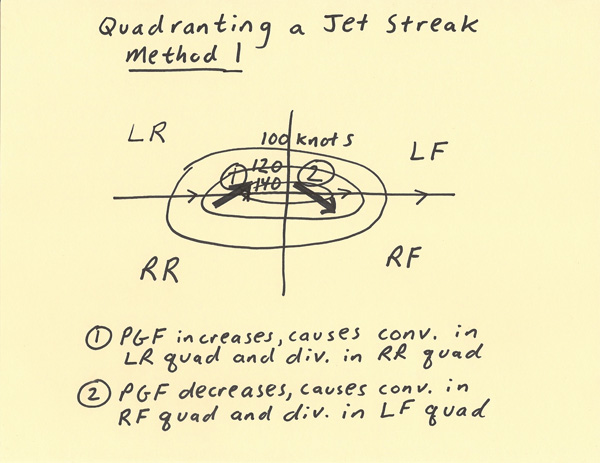 The purpose of quadranting a jet streak is to find where the regions of lifting and sinking air are located. Upper level divergence contributes to lifting air while upper level convergence contributes to sinking air. When reading about “upper level divergence” in a forecast discussion, jet streak divergence is one contributing factor to upper level divergence and thus rising air. Rising air enhances precipitation chances and storm chances. The regions of upper level divergence (rising air) are in the Right Rear quadrant and the Left Front quadrant while the regions of upper level convergence (sinking air) are in the Left Rear and Right Front quadrant. This writing goes over two interpretations for why lifting or sinking occurs in particular quadrants. We begin with method 1 using the diagrams below labeled “Quadranting a Jet Streak: Method 1”, and “PGF and Coriolis comparison in jet streak”. A parcel of air enters the jet streak in the entrance sector at position 1 for example in the diagram below. As the parcel moves toward the jet core, the parcel is accelerating due to the higher pressure gradient. The Pressure Gradient Force (PGF) acts very quickly on the parcel of air but the Coriolis (f) acts slowly. Thus, the PGF overpowers the Coriolis force and the parcel deviates more in the direction of the PGF (position 2). A longer vector of PGF at position 2 as compared to the Coriolis is used to indicate the PGF is stronger than the Coriolis. Between position 2 and position 3, the Coriolis is coming into adjustment with the PGF and the parcel deviation of motion stops. However, when the parcel starts coming out of the jet core at position 3 and the wind speeds slow (and thus PGF weakens and the parcel decelerates), the PGF rapidly reduces while the Coriolis is slow to adjust. The temporarily stronger Coriolis causes the parcel to deviate toward the direction of the stronger Coriolis (at position 4). The Coriolis adjustment completes between position 4 and position 5. At position 5, the parcel is once again in balance between the PGF and Coriolis forces. In the right rear quadrant (from position 1 to 2), there is an evacuation of mass as more air mass piles into the left rear quadrant. This deficit of air helps pull up air from below (thus rising air in right rear quadrant). In the left front quadrant (from position 3 to 4), there is also an evacuation of mass more air mass piles into the right front quadrant. This deficit of air helps pull up air from below (thus rising air in the left front quadrant). 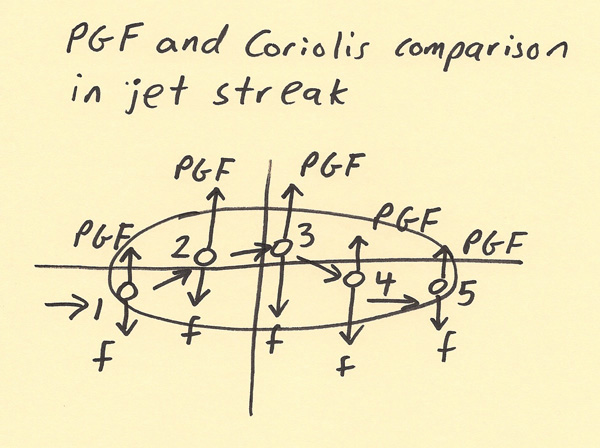 Method 2 analyzes why convergence and divergence occurs from a vorticity perspective. Method 2 uses the diagram below starting with the diagram labeled “Quadranting a Jet Streak: Method 2”. In the diagram, a vorticity maximum is generated on the north side of the jet streak while a vorticity minimum is generated on the south side of the jet streak. The wind flow through the vort max and the wind flow through the vort min produces regions where positive vorticity advection (PVA) and negative vorticity advection (NVA) are occurring. It is the Right Rear (RR) and Left Front (LF) quadrant that PVA is occurring. It is the Left Rear (LR) and Right Front (RF) quadrant that NVA is occurring. PVA produces uplift while NVA promotes sinking air. Thus, precipitation and storms are favored in the Right Rear and Left Front quadrants. In the Left Rear quadrant, the wind flow is blowing lower values of vorticity from left to right across the diagram. This generates NVA. In the Right Rear quadrant, the wind flow is flowing higher values of vorticity from left to right across the diagram. This generates PVA. In the Left Front quadrant, the wind flow is blowing higher values of vorticity from left to right across the diagram. This generates PVA. In the Right Front quadrant, the wind flow is blowing lower values of vorticity from left to right across the diagram. This generates NVA. PVA generates uplift while NVA generates sinking air. 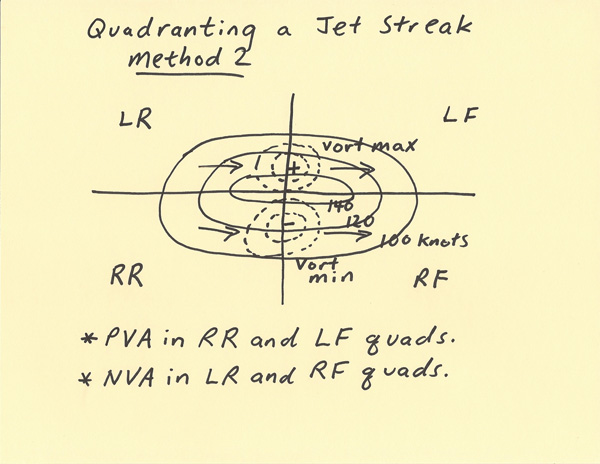 The vorticity produces is primarily shear vorticity. The last diagram shows how cyclonic and anticyclonic vorticity from shear are generated. The cyclonic shear situation represents what is happening on the north side of the jet streak. An axis drawn north of the jet streak will twist cyclonically over time since winds are stronger to the south and weaker to the north in this portion of the jet streak. The anticyclonic shear situation represents what is happening on the south side of the jet streak. An axis drawn south of the jet streak will twist anticyclonically over time since winds are stronger to the north and weaker to the south in this portion of the jet streak. 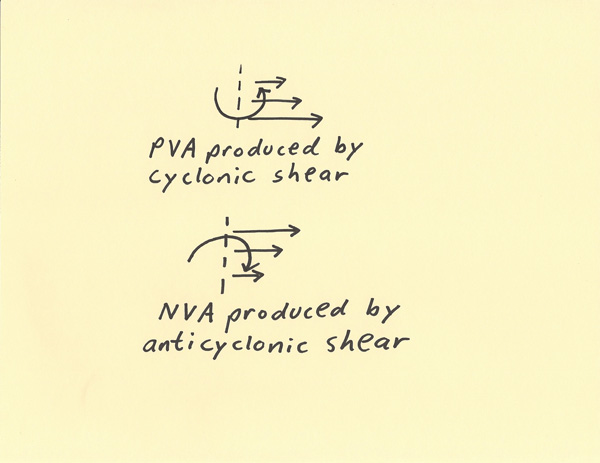 |