
Like CAPE, LI (Lifted Index) assesses instability. It compares the actual 500 mb temperature to the theoretical temperature at 500 mb that would result from a parcel of air rising from the boundary layer to 500 mb. If the parcel temperature is warmer than the actual 500 mb temperature then the LI is negative. A negative LI indicates instability and the more negative the value then the more unstable the air. Unlike a single Skew-T sounding, a map can show how the LI varies over a big area. Multiple sounding stations, various model runs and current weather data can be used to calculate the LI over an entire region. The example below shows Lifted Index over Illinois and nearby areas. The LI values are very negative and this indicates strong instability. Storms developing in this region from surface based convection can be expected to have very strong updrafts. This increases the likelihood for severe weather such as severe convective wind gusts and large hail. Notice the stabilizing influence over Lake Michigan. This results because the water heats up less than the land. The warmer temperatures over the land lead to higher values of instability. LIFTED INDEX Positive number: Stable 0 to -4: Marginal instability -4 to -7: Large instability -8 or less: Extreme instability 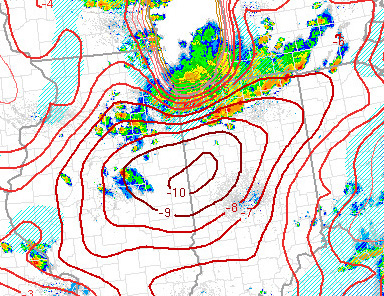 |