
The KI is a combination of the Vertical Totals (VT) and lower tropospheric moisture characteristics. The VT is the temperature difference between 850 and 500 mb while the moisture parameters are the 850 mb dewpoint and 700 mb dewpoint depression. KI = (T850 - T500) + (Td850 - Tdd700) Operational interpretation of value obtained: 15-25: small convective potential 26-39: moderate convective potential 40+: high convective potential The image below shows an example of a map of K index values. Many of the values on the map are 30 or greater. This indicates a significant threat for convection. High values suggest there is enough moisture and instability to support thunderstorms if there is adequate lifting. The value can be misleading at times thus it is a good idea to check over a variety of weather data (CAPE, LI, surface dewpoints, wind shear, dynamic lifting mechanisms, capping, convective instability, etc.) to get a better feel for the convective potential and storm characteristics that storms could have if they develop (severity, tornadic potential, etc). 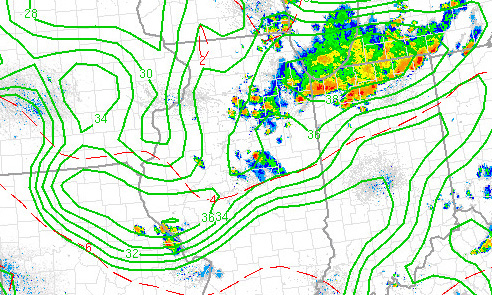 |