
Perhaps better known as "Silicon Valley" to those living outside the area, the Santa Clara Valley is located to the southeast of San Francisco. The name refers to the many tech corporations (Intel, IBM, Apple) that call it home. Also located in the valley is San Jose, the Bay Area's largest city with a population of more than 900,000 and recently passed Detroit to become the nation's 10th largest city. The topography of the Santa Clara Valley includes flatlands a few feet above sea level near the inner bay waters. The elevation rises to nearly 300 feet above sea level around the foothills of the South Bay. Just to the south and west rising to nearly four thousand feet above sea level is the Santa Cruz mountain range. This includes several prominent peaks including: Loma Prieta (3,786 ft.), Mt. Umunhum (3,486 ft.) and Mt. McPherson (3,231 ft.). Coincidentally, these peaks making up the highest rises in the mountain range lie just to the southwest of San Jose. This is an important topographical fact that comes into play during the region's rainy season. Annual rainfall in the Bay Area ranges tremendously by location including: Santa Rosa 30.56" San Francisco (WSO AP) 20.29" Oakland (Museum) 23.55" San Jose 15.08" Santa Cruz 30.78" Source: Western Region Climate CenterSanta Rosa and the North Bay typically receive the most rain, aided by orographic lifting from the nearby mountains and its northern location that lies in closer to the path of the polar jet stream during the winter months. San Francisco and Oakland have bodies of water just to their west where rain and wind come in with little resistance. Santa Cruz and San Jose are a more interesting pair to observe. If you were to follow a parcel of air moving in off the Pacific Ocean following the typical west-southwest direction of most winter storms, you would first cross Santa Cruz before heading northeast over the southern Santa Clara Valley (San Jose area). The rainfall discrepancy between the two locations (Santa Cruz - 30.78" / San Jose 15.08") is the result of significant "rain shadowing" in the lee side of the Santa Cruz mountains. "Rain shadowing" refers to the effect mountain ranges can have with respect to precipitation. Areas in the windward or western flank of the north-south running ranges often will see much more precipitation whether it be rain or snow. As the Santa Cruz Mountains face roughly west-southwest, the low level jet will often encounter the mountain range at a near perpendicular angle allowing for a maximized orographic lifting effect. As this air cools and condenses, precipitation results. In strong warm air advection events, the low level jet can act like a conveyor belt supplying a steady stream of moisture that can result in flooding rains or in colder situations "white-out" conditions across mountain passes. On the other side of the coin is the leeward side of these mountain ranges where the air descends and warms as it moves down the opposite side of the range. This has the effect of drying the air mass and limiting precipitation totals as seen in many winter rain events in the Santa Clara Valley. There are many instances of this on the West Coast, most notably the precipitation differences between the west slope of the Sierra Nevada (Blue Canyon, Truckee, California) versus the drier and colder side of the Sierra (Reno, NV). The most significant example of a rain shadow is found near the flanks of the Olympic Mountains in Western Washington. Hoquiam which sits on the southwestern-facing slope of the Olympic Mountains receives nearly 70 inches of rain per year. To the northeast in the lee-side of the same mountains lies Sequim. This site receives only 16.51" inches of rain annually! A remarkable total considering the amount isn't much more than the annual total of Los Angeles, California (LA Civic Center 14.92"). Sequim is clearly a perfect example of sitting within a regional "rain shadow". The town is merely 75 miles away from one of the wettest areas in the 48 contiguous states found in Quillayute, WA on the NW tip of the Olympic Peninsula with 101.56" rain annually. As in the case of Sequim, WA though in a much less extreme sense the Santa Clara Valley sees substantially less rainfall than the western Santa Cruz Mountains during the winter storm season. Stronger Pacific storms can bring rainfall extended over two or three days time that in worst case scenarios include stalling frontal boundaries. The so-called "Pineapple Express" situation falls under this type of storm setup. In this type of rain event, a steady stream of moisture feeds in from the subtropics usually near the Hawaiian Islands where the term gets its name. A strong 300mb jet usually 100-150 knots aims in on California's Central coast while the low level jet in the warm sector aims in on the Bay Area from a southwesterly direction. These storms pack much warmer air with far higher PW values than their Gulf Of Alaska counterparts. For this reason storms with origins in the Central Pacific are more often flood producers for the Bay Area. The influx of warmer, moisture laden air (WAA) adds synoptic scale lift to the region as the coastal mountains provide an added orographic boost that can easily yield flooding rains in a relatively short period of time. As is the case with the models sometimes underestimating precipitation potential from strong WAA events out of the Gulf of Mexico, strong WAA events out of the Central Pacific region with a tap into the subtropics can result in heavier than expected rain totals. This scenario played out most recently during a major flood event in Napa and Marin counties from Dec 31st, 2005 - Jan 2nd, 2006. Some areas received up to eight inches of rain in a 24-hour period as the freezing level never dropped below 7000 feet during the heaviest rainfall. With most of the coastal mountains sitting at 4,000 and lower, coupled with steep passes and topography the resulting runoff overwhelmed creek and river systems. Many went from near empty to beyond bank full within hours for some of the fastest widespread flooding the region had seen in years. While extensive flooding was happening to the north, some areas in the South Bay including San Jose saw little more than an inch of rain during the same time. As was the case with 2005's "New Year's Eve Storm", long duration "warm" rain events are among the greatest Winter forecasting challenges for Bay Area meteorologists. For the purpose of this paper, I analyzed a typical "warm" rain weather system from February 8th-11th, 2007. My goal was to see how well graphical model output such as the GFS and others could handle the rainfall totals and geographical spread over the Bay Area (see jpeg presentation for media slides from 2/08-11/2007). What I found was the models both numerically and graphically "broadbrushed" the rain event. In looking at the charts and QPF estimates there was at times little differentiation between San Jose versus Half Moon Bay or other towns located in the far wetter western flank of the Santa Cruz Mountains. These same computer models specifically the ETA and AVN are used by weather graphics services such as WSI (Weather Services International) to generate "futurecast" products or "true-view" sky conditions based on model output. Herein lies another problem. If the computer models "broad brush" the precipitation amounts and coverage, a broadcast meteorologist's on-air graphics package will also reflect the same potentially inaccurate biases. The most accurate forecasting method in these situations is to use the model output as a guide for precipitation intensity but even more important for accuracy's sake is taking a look at the upper level wind charts and satellite imagery (see multimedia kit for examples). Ideally, the analysis of 850 mb to the surface wind speeds / direction and the placement of the low level jet would be a great aid when forecasting the onset of heavier precipitation or lack thereof due to rain shadowing for the Santa Clara Valley. This should provide a meteorologist with a better estimate of initial rainfall totals during the WAA portion of the rain event. Using a suite of upper level wind charts from all levels (200/300/500/850mb), pressure charts and satellite photos should help reveal whether a rain shadow is likely long before the radar beam encounters the first rain drops. 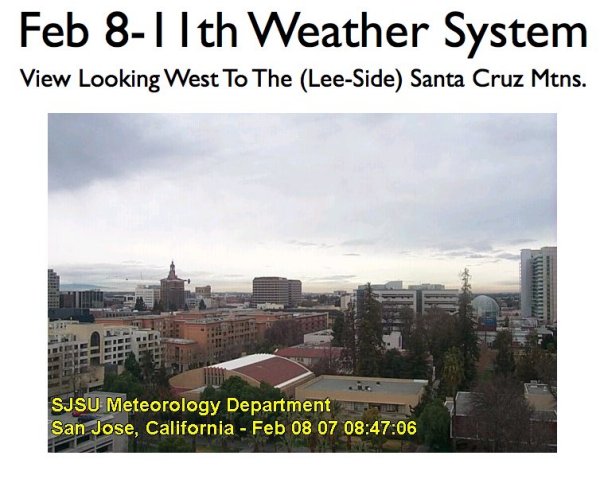 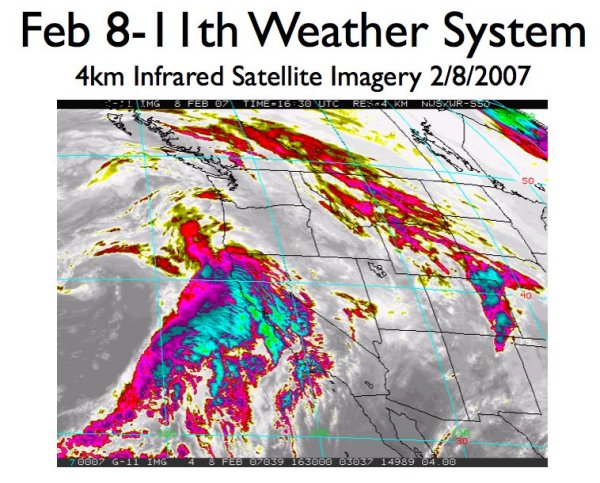 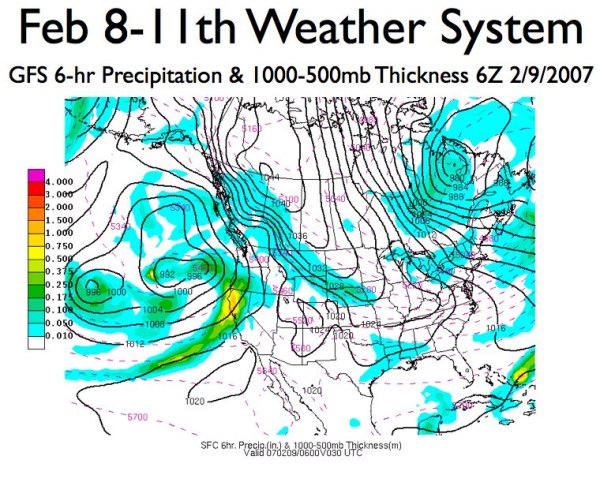 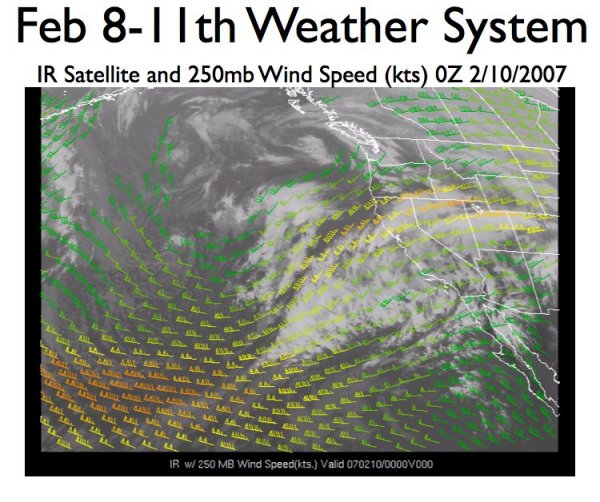 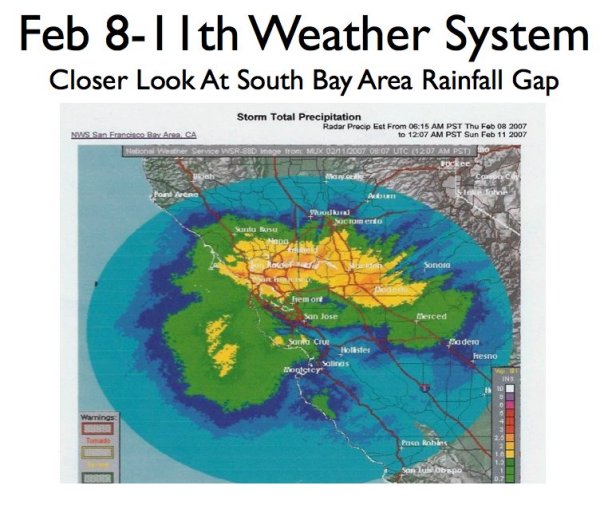 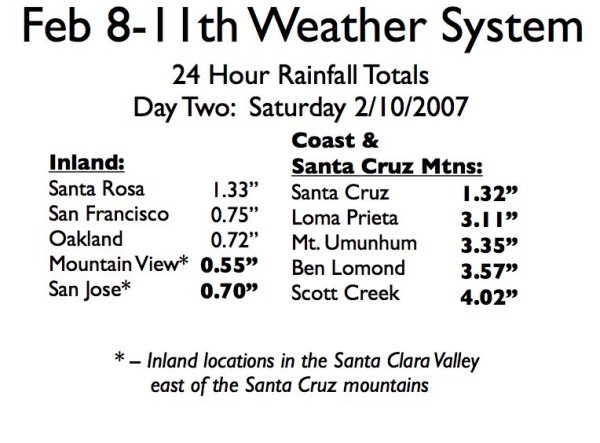 References: San Jose / Bay Area Climate: Miguel Miller / NOAA Technical Memorandum?NWS WR-259 http://www.wrh.noaa.gov/mtr/sfd_sjc_climate/sjc/SJC_CLIMATE3.php California/Washington Climate Information: http://www.wrcc.dri.edu/climsum.html Meteorology Background & Research Information http://www.theweatherprediction.com Images & Data: San Jose State University Dept. Of Meteorology http://www.met.sjsu.edu/weather/weather.html National Weather Service - Monterey, CA http://www.wrh.noaa.gov/mtr/ National Weather Service - Seattle, WA http://www.wrh.noaa.gov/sew |