
Typically "Super Tuesday" is synonymous with presidential primaries, political speeches, and news media clambering to cover the hectic events of the night, but the election took a back seat for people living in the southern U.S. on February 5, 2008. One of the largest and most deadly tornado outbreaks in more than 20 years took place as the ballots were starting to pour in for the night. Some locations in Tennessee and Arkansas that were participating in the primary elections were even forced to close the polls early as a result of the severe weather that would affect the area. At 10:16 A.M. CST, February 5, 2008 the Storm Prediction Center (SPC), a division of the National Oceanic and Atmospheric Administration (NOAA), in Norman, OK issued their Day 1 convective outlook for the day. What can be somewhat of a mundane task most often in the winter months was no typical late winter forecast at all. This would be a very active weather day across the entire eastern half of the United States and particularly the southern region of the country as well as the National Weather Service agencies across the areas that were impacted. There was a high risk for severe weather in the mid-south with the primary area affected being an area encircling Arkansas and extending into Western Tennessee and Northern Louisiana which is shown below. Also illustrated is a moderate to slight probability sector surrounding this area which included the majority of the eastern United States. The SPC concluded that the atmospheric variables were favorable for severe thunderstorms, large hail, damaging winds, and long-lived supercell development. Significant tornadoes associated with these supercells were the largest concern of the day and a high probability of their occurrence was also acknowledged and addressed in detail in the mesoscale discussion contained on the SPC website for the day. The prediction of the SPC panned out which was an unfortunate turn of events for many people in the southern United States. 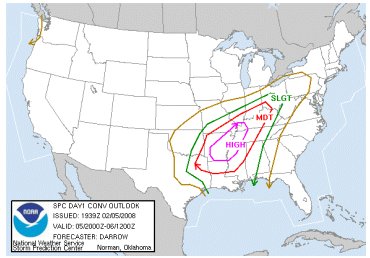 There were many different atmospheric factors that contributed to the synoptic-scale weather pattern that were consistent for major outbreaks of tornadoes and severe weather. The event was a conglomeration of different parameters with the main one being a powerful low pressure that was closing in from the Great Plains states. Another pivotal factor was that the south experienced many record-breaking temperatures during the day with some areas reaching 80°F! The high temperatures were associated with strong southerly winds and the warm air advection (WAA) that resulted from these winds. Temperatures typically ranged from mid 60's to 70's with the boundary layer being very moist having dew points reaching into the high 50's to mid 60's throughout the majority of the region. The strong WAA into the region enhanced the moisture and heat that had already obtained record-breaking levels. Even after sunset in most regions, the temperature dropped minimally leaving high dewpoints in a nearly saturated environment which supplied copious amounts of moisture to the thunderstorms. Further destabilization of the atmosphere was able to take place due to the high temperatures in the planetary boundary layer (PBL) which acted as a lifting mechanism to the severe storms. Secondly, a deep upper level trough extended from the southern plains into the gulf coast states and back through the Ohio River Valley in association with a strong area of low pressure centered over the Kansas City, MO area. Due to the counterclockwise circulation of the low, a strong cold front was slowly migrating southeast along a path from the Ohio River Valley to eastern Texas which was an area that was conversely experiencing low-level WAA into the region. This was the primary source of lift that was necessary in order to produce the severe weather that was experienced in the area. These conditions were accompanied by strong winds in the mid and upper levels ranging from 90 knot at 500 mb level to 130 knots at the 250 mb layer. This increase with height caused significant speed shear. In the Ohio valley, which was experiencing some of the strongest upper level winds, the result was that of a long lived squall line in which a widespread derecho event occurred. Positive vorticity advection (PVA) was also occurring in an area from Texas into Tennessee following the upper level flow. An area of difluence, an area where winds on the same plane are flowing at angles away from each other, developed over western Tennessee and assisted in the development of supercells in this region. Difluence aids uplift by pulling up air from below to fill the void left in the area due to the spreading apart motion of the wind. In addition to all of this, there was also a weak cap that existed in the region which was quickly broken through as the convection increased through the daytime hours resulting in an explosion of severe weather. The convective storms exploded throughout the day and the unstable environment along with upper level winds and moisture source helped to maintain this extremely powerful system. Below is a 500 millibar (mb) weather chart from 12Z on February 6 which shows the vorticity maximum and flow around the deep low pressure and trough that were important factors in the outbreak. 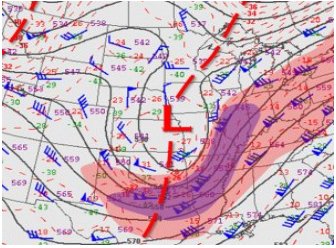 Tornadoes in February are not necessarily rare, but statistically speaking they only make up 5% of the annual tornado distribution in the United States. The unseasonably warm temperatures were primarily due to La Nina event of this past winter. The system was similar to an early spring type setup with the extreme warmth of the predominant temperatures that were present in the region. The combination of warm temperatures and the strong cold air mass that was advecting into the area combined to produce a perfect environment for a large scale severe weather event. After all was said and done, there were a total of 131 tornadoes reported. The death toll totaled 57 with several hundred more being injured. The areas hardest hit were those of Arkansas, Alabama, Kentucky, Tennessee, and Mississippi. The majority of the tornadoes reported were from several long lived supercells that traveled through these states. Tennessee was the hardest hit with a total of 32 fatalities in the deadliest outbreak in 34 years for the state. Arkansas was also in the path of system and was the first area of the mid-south to experience the fury of the storms that afternoon and night. Arkansas had a single tornado that trekked a total of 123 miles, which is longest path of a single tornado ever recorded in the state since detailed records began to be kept there in 1950. Deaths in the state totaled 13 from the storms. The majority of the Midwest was spared from the tornadic storms, but the intense squall line that caused some straight line wind damage from southeastern Illinois all the way over to western West Virginia was nonetheless a very widespread and significant event. To the northwest of the system there was a major winter storm that was triggered in the cold sector of the low pressure system. Property damage is still being reported for the outbreak. Below is a map of the tracks of the supercells and their associated tornadoes and the location of the squall line that progressed through the region. "Super Tuesday" will forever have an alternate meaning for those of us who forecast and monitor weather. This was a very memorable and significant event in the meteorological community that will not be soon forgotten. 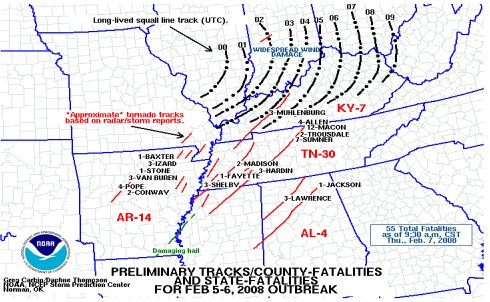 Acknowledgments: Feb, 2008 1630 UTC Day 1 Convective Outlook. Storm Prediction Center. Retrieved Mar. 22, 2008. http://www.spc.noaa.gov/products/outlook/archive/2008/day1otlk_20080205_1630.html Preliminary Tracks/County-Fatalities and State-Fatalities For Feb. 5-6, 2008 Outbreak. Greg Carbin, Greg and Thompson, Daphne. Storm Prediction Center. Retrieved on Mar. 23, 2008. http://upload.wikimedia.org/wikipedia/commons/d/de/Noaa-outbreak-graphic.png Severe Storms. National Climatic Data Center. Retrieved on Mar. 23, 2008. http://lwf.ncdc.noaa.gov/oa/climate/research/2008/feb/hazards.html "Super Tuesday" Outbreak Weather Summary. National Weather Service Forecast Office in Huntsville, AL. Retrieved on Mar. 23, 2008. http://www.srh.noaa.gov/hun/stormsurveys/2008-02-06/weather.php U.S. Tornado Climatology. National Climatic Data Center. Retrieved on Mar. 22, 2008. http://lwf.ncdc.noaa.gov/oa/climate/severeweather/tornadoes.html |