
1. Immediate temperature Interpretation One paradox that is faced in the US is that temperatures reported to the public are most often in degrees F, however, analysis charts, forecast panels, and Skew-T plots use degrees C. One must readily be able to translate a Celsius temperatures to a Fahrenheit temperature and vice versa. One method is to simply use the formula F = 9/5(C) + 32Although this method is most accurate, it takes time and requires a calculator. An easier method is to memorize a few sets of F and C temperatures and interpolate to get an estimate of the temperature. Memorize the values below: -10° C = 14° F 0° C = 32° F 10° C = 50° F 20° C = 68° F 30° C = 86° F 40° C = 104° FKeep in mind that: 1. There are ABOUT 2 ° F in one degree C 2. A 10 degree increase on the Celsius scale results in an 18 degree Fahrenheit change Once the 6 values above or memorized, you only need to interpolate to get an approximate temperature e.g. What is 17° C? well, 10 is 50 and 20 is 68…. Since there is a 3 degree difference between 17 and 20 on the C scale, then that is a difference of about 6 on the F scale, therefore the temp is 68 - 6 = 62° F e.g. What is 83° F? well, 30 is 86…. Since there is a 3 degree F temp change then that means there is a 1.5 C temp change… therefore the temp is about 28.5 C 2. See the atmosphere is 4-D The 4 dimensions are length, width, height and time. *When looking at a composite of analysis charts and forecast panels it is important to put those images together in your mind and put the atmosphere into motion. *When looking at a 2-D analysis chart or forecast panel, try to visualize vertical as well as horizontal synoptic motion. *Air rarely flows on a perfect horizontal plane, especially in the vicinity of low pressure cyclones. Diagram below 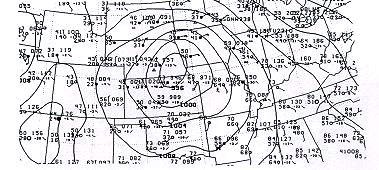 Processes important to pick out: *Wind speed and direction (advection) *Isentropic lifting and descent (warm/moist air advection leads to rising air and cold/dry air advection leads to sinking air) *Visualize how vorticity, thermal advection, and jet streaks will effect atmospheric motion in a 4-D sense. *Look for "bumps in the road" (e.g. outflow boundaries, sea breeze fronts, any differential heating) LOOK at analysis charts and try to visualize atmospheric motion in 4-D!! 3. Memorize Indice values and interpretation K-index (KI) Convective potential (T850 - T500) + (Td850 - Tdd700) Less than 15 Convection not likely 15 to 25 Small potential for convection 26 to 39 Moderate potential for convection 40+ High potential for convectionTotal Totals index (TT) Severe weather potential (T850 - T500) + (Td850 - T500) Less than 44 Convection not likely 44 to 50 Convection likely 51 to 56 Widely scattered severe weather possible 56 + Scattered severe storms possibleMemorization techniques: *where the values for KI end, TT begins *3 of 4 terms in the two equations are the same ___________________________________________________________ Storm Relative Helicity (SRHEL or HEL) Inflow (m/s) * Streamwise vorticity (m/s) = m^2/s^2 150 to 300 Possible supercell 300 to 400 Supercells favorable 400+ Tornadic supercells favorableSevere Weather Threat Index (SWEAT) Uses TT, 850Td, and wind shear information 150 to 300 Slight severe 300 to 400 Possible severe 400+ Tornadic severe possibleMemorization technique: both SRHEL and SWEAT values have nearly the same scale and meaning! ______________________________________________________________ CAPE (Joules per kilogram) Lifted Index and Showalter Index (° C) Amount of positive buoyancy Amount of positive buoyancy 1-1,500 Positive CAPE -1 to -4 Marginal 1,500 to 2,500 Large CAPE -5 to -7 Large 2,500 + Extreme CAPE -8 or less ExtremeMemorization techniques: Both sets of these indices deal with instability of the atmosphere (parcel versus environmental lapse rate) _______________________________________________________________ Bulk Richardson Number (CAPE / 0-6 km shear) >45 CAPE overpowers shear <45 Supercells possible (teens = good balance of CAPE and shear) <10 Very sheared environment (shear overpowers CAPE)Energy Helicity Index EHI > 1 Supercells possible 1 to 5 F2, F3 tornadoes possible 5+ F4, F5 possiblesSpeed Shear (change in wind speed with height) units of s^-1 0 to 3 Weak 4 to 5 Moderate 6 to 8 Large 8 + Severe 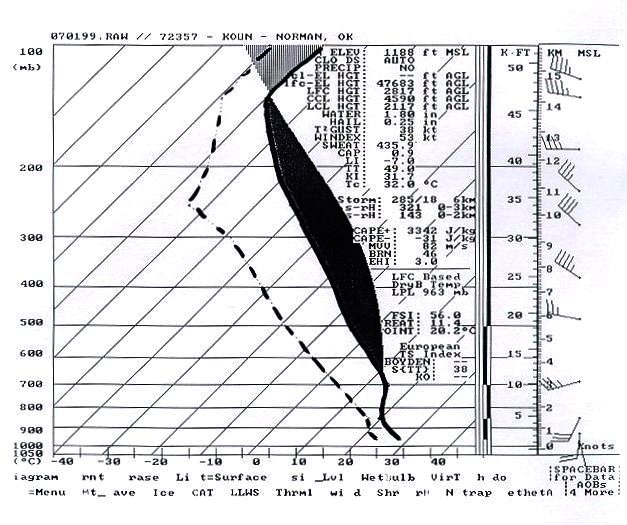 This link has all major Skew-T indices, interpretation, and important notes: http://theweatherprediction.com/severe/indices/index.html 4. Understand how the polar jet develops and builds troughs and ridges a. The jet stream is caused by temperature gradients. Cold air to the north of the jet has a much lower thickness than air to the south of the jet. This creates a pressure gradient force from the warm air toward the cold air. The Coriolis force turns the southerly air to the right of the path of motion, thus giving the jet stream the typical mid-latitude west to east motion. See diagram below 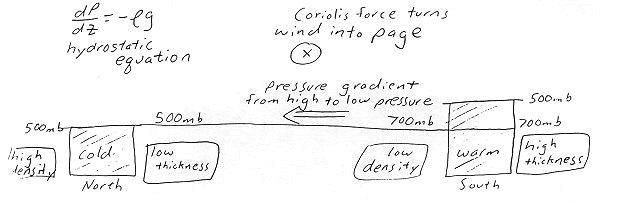 b. Troughs and ridges not only build due to the thermal gradients but also because of jet streaks imbedded within the jet stream flow. RULE OF THUMB: If the jet streak is on the left side of the trough, the trough will deepen. If the jet streak is on the right side of the trough, the trough will lift. Newton's first law: An object in motion tends to stay in motion *Jet streaks hold together across LONG distances 5. Understanding vorticity Vorticity is caused by 3 components which are shear vorticity, curvature vorticity and earth vorticity. Diagrams of each are shown below. 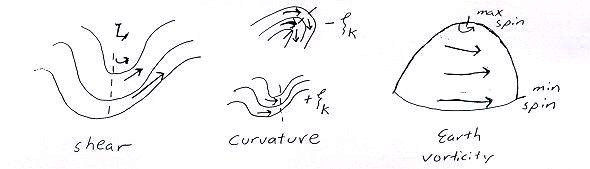 Counterclockwise rotation in the NH results in positive vorticity while clockwise rotation results in negative vorticity. PVA and uplift occur with vort max that has a vorticity gradient nearly perpendicular to the height contours. PVA only occurs on the downwind side of the vort max.  PVA is a function of ***Amount of speed shear + directional shear + Corilis (determines VALUE of vort max) 6. Understand how moisture and thermal advection causes rising or sinking of air  Just because the temperatures are hot or the dewpoint is high, does NOT mean a location is experiencing moisture or warm air advection. The average temperature of a layer of air must be increasing or the average dewpoints in a layer of air must be increasing through time. If warm air advection or moisture advection occurs at the surface, is will cause air to expand and thus rise. Therefore, two of the main synoptic scale lifting mechanisms are surface to 700 millibar warm air advection and moisture advection. Advection is a function of the following: (diagram below)  7. Answers to the "BIG" questions and their paradoxes a. Is global warming occurring? Evidence for: Evidence against: b. Does El Nino cause weather disasters? Evidence for: Evidence against: c. Does pollution harm human health and the earth's ecosystem? Evidence for: Evidence against: d. Does a warmer than normal winter mean there is going to be a warmer than normal summer? Evidence for: Evidence against: e. Are hurricane and tornado frequency increasing with time? Evidence for: Evidence against: 8. Some useful advice a. Keep up with the weather everyday, even on off days b. Have all important weather web pages bookmarked on the Internet c. Look at all available weather data d. Keep up with readings, conferences e. Do not become dependent on MOS data. Research NWS forecasts and discussions for validity. f. School visits (the more the merrier) |